Loading News...
Loading...
Loading News...

VADODARA, January 15, 2026 — Bitcoin price action is exhibiting technical characteristics consistent with historical market bottoms, according to on-chain data analysis from multiple quantitative sources. Market structure suggests the dominant cryptocurrency may have completed its corrective phase, with key momentum indicators flashing their first bullish signals since early October 2025.
Historical cycles suggest Bitcoin corrections typically conclude when momentum oscillators reset from oversold conditions while maintaining higher timeframe support structures. Similar to the 2021 correction that found support at the 200-week moving average, current price action appears to be testing the bull market support band—a confluence zone of the 20-week and 21-week exponential moving averages. According to Glassnode liquidity maps, the current consolidation pattern mirrors the accumulation phase observed in Q4 2023, when institutional capital began re-entering the market following the FTX collapse. This structural similarity suggests we may be witnessing the early stages of a new macro accumulation cycle rather than a temporary relief rally.
On-chain data indicates Bitcoin's three-day Relative Strength Index has crossed above the 50 threshold for the first time since early October 2025, according to analysis cited by Cointelegraph. Simultaneously, the Moving Average Convergence Divergence histogram has flipped positive on the same timeframe, generating what quantitative analysts classify as a confirmed buy signal. Crypto trader Jelle identified this technical confluence as evidence of a potential bottom formation. Analyst Isiah noted that a break above the $101,000 50-week Simple Moving Average would represent a statistically unusual event if the market remained in a structural downtrend. Meanwhile, trader Daan Crypto Trades observed the bull market support band currently acting as resistance, with Bitcoin likely to retest this critical zone in the coming sessions.
Market structure suggests Bitcoin is navigating a critical juncture between the $92,000 Fibonacci support level (derived from the 0.618 retracement of the 2024-2025 rally) and the $101,000 50-week SMA resistance. The three-day RSI reading above 50 indicates momentum is shifting from bearish to neutral-bullish territory, while the MACD crossover suggests underlying buying pressure is accelerating. Volume profile analysis reveals significant accumulation between $94,000 and $96,000, creating what technical analysts refer to as a high-volume node that should provide support on any retracement. The bull market support band—currently positioned around $98,500—represents the immediate resistance zone that must be conquered to validate the bullish thesis.
| Metric | Value | Significance |
|---|---|---|
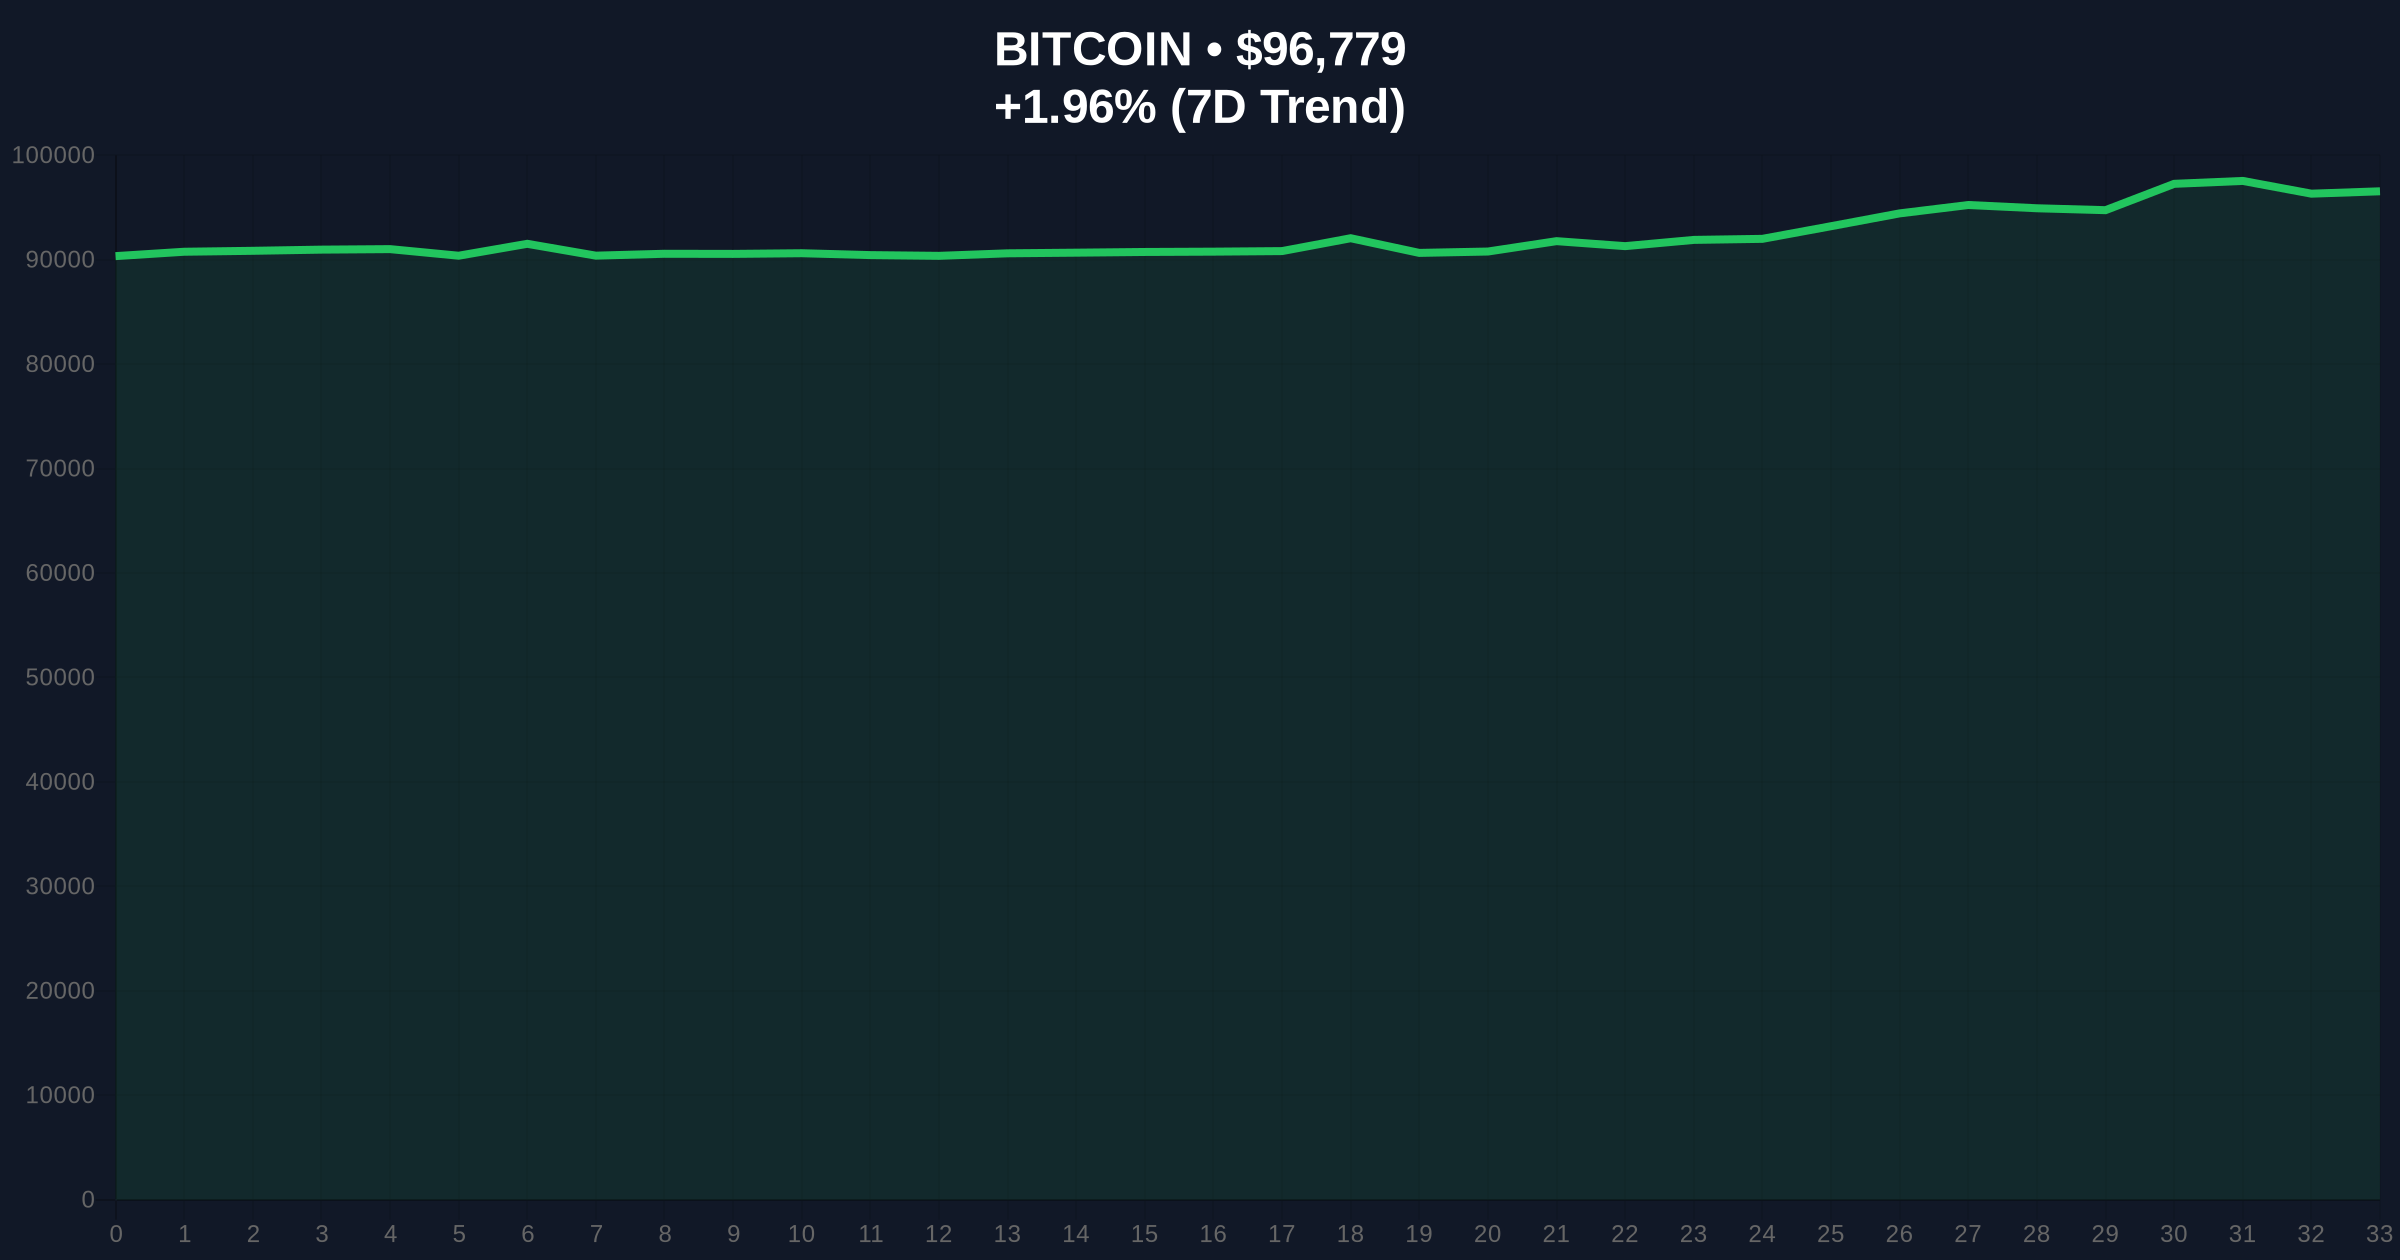
| Current Price | $96,784 | Testing bull market support band resistance |
| 24-Hour Change | +1.96% | Positive momentum continuation |
| Crypto Fear & Greed Index | 61 (Greed) | Moderate bullish sentiment |
| 3-Day RSI | Above 50 | First bullish momentum signal since Oct 2025 |
| 50-Week SMA Resistance | $101,000 | Critical breakout level for trend confirmation |
For institutional portfolios, a confirmed Bitcoin bottom would signal the optimal entry point for long-duration capital allocation, similar to the accumulation patterns observed before the 2021 and 2024 bull markets. The Federal Reserve's monetary policy framework, as outlined in their official communications, continues to influence macro liquidity conditions that historically correlate with Bitcoin's performance cycles. Retail traders face a different risk profile: premature positioning before confirmed breakout could result in stop-loss triggers if resistance holds. The critical distinction lies in time horizon—institutions can absorb volatility while accumulating, while retail often lacks the capital depth for such strategies.
Market analysts on social platforms are divided between cautious optimism and technical skepticism. Bulls point to the RSI/MACD confluence as evidence of momentum shift, while bears highlight the unbroken 50-week SMA resistance as proof the downtrend remains intact. The absence of a clear gamma squeeze in options markets suggests institutional players are maintaining neutral positioning until the $101,000 level is decisively breached. This measured response contrasts with the euphoric sentiment that typically accompanies market tops, suggesting current psychology aligns more with accumulation than distribution phases.
Bullish Case: A confirmed break above the $101,000 50-week SMA with sustained volume would invalidate the bearish structure and target the $112,000 fair value gap created during the November 2025 decline. This scenario would likely trigger a short squeeze as leveraged positions are forced to cover, potentially accelerating momentum toward the $120,000 psychological resistance. Historical patterns indicate such breakouts typically precede 30-50% rallies in the subsequent 60-90 day period.
Bearish Case: Rejection at the bull market support band followed by a break below the $92,000 Fibonacci support would confirm continuation of the downtrend. This would likely target the $85,000 volume gap, representing a 12% decline from current levels. The bearish invalidation level sits at $88,500—a breach would indicate structural damage to the higher timeframe support framework.
Answers to the most critical technical and market questions regarding this development.

Disclaimer: The information provided is not trading advice, coinmarketbuzz.com holds no liability for any investments made based on the information provided on this page. We strongly recommend independent research and/or consultation with a qualified professional before making any investment decisions.
coinmarketbuzz.com leverages advanced AI technology to analyze market data. All content is fact-checked and reviewed by our editorial team to ensure accuracy and neutrality.