Loading News...
Loading...
Loading News...

VADODARA, December 31, 2025 — U.S. spot Ethereum ETFs recorded $67.84 million in net inflows on Dec. 30, reversing a five-day streak of net outflows, according to data compiled by TraderT. This latest crypto news marks a significant shift in institutional sentiment toward Ethereum, occurring against a backdrop of extreme market fear with the Crypto Fear & Greed Index at 21/100. Market structure suggests this inflow event could represent a liquidity grab at key technical levels, similar to patterns observed during the 2021 bull market correction.
This inflow reversal mirrors historical ETF flow patterns seen during previous market cycles. In 2021, similar ETF inflow reversals often preceded short-term price recoveries as institutional capital re-entered oversold markets. The current extreme fear reading of 21/100 indicates capitulation-level sentiment, which typically creates favorable entry points for contrarian investors. According to on-chain data, Ethereum's network activity has remained robust despite price volatility, with daily active addresses maintaining levels above 400,000. This divergence between price action and fundamental usage suggests underlying strength that may not be reflected in current valuations.
Related developments in the current market environment include Bitcoin ETFs snapping a 7-day outflow streak with $354.8 million inflows and short squeezes dominating crypto liquidations as market fear hits extreme levels.
On December 30, 2025, U.S. spot Ethereum ETFs recorded $67.84 million in net inflows, according to TraderT data. This ended a five-day outflow streak that had seen cumulative outflows exceeding $120 million. The inflows were led by Grayscale's ETHE with $50.19 million and its Ethereum Mini ETF with $13.95 million. Fidelity's FETH contributed $3.7 million in new funds. This data indicates selective institutional accumulation despite broader market uncertainty, with Grayscale products capturing approximately 94.5% of the total inflow volume.
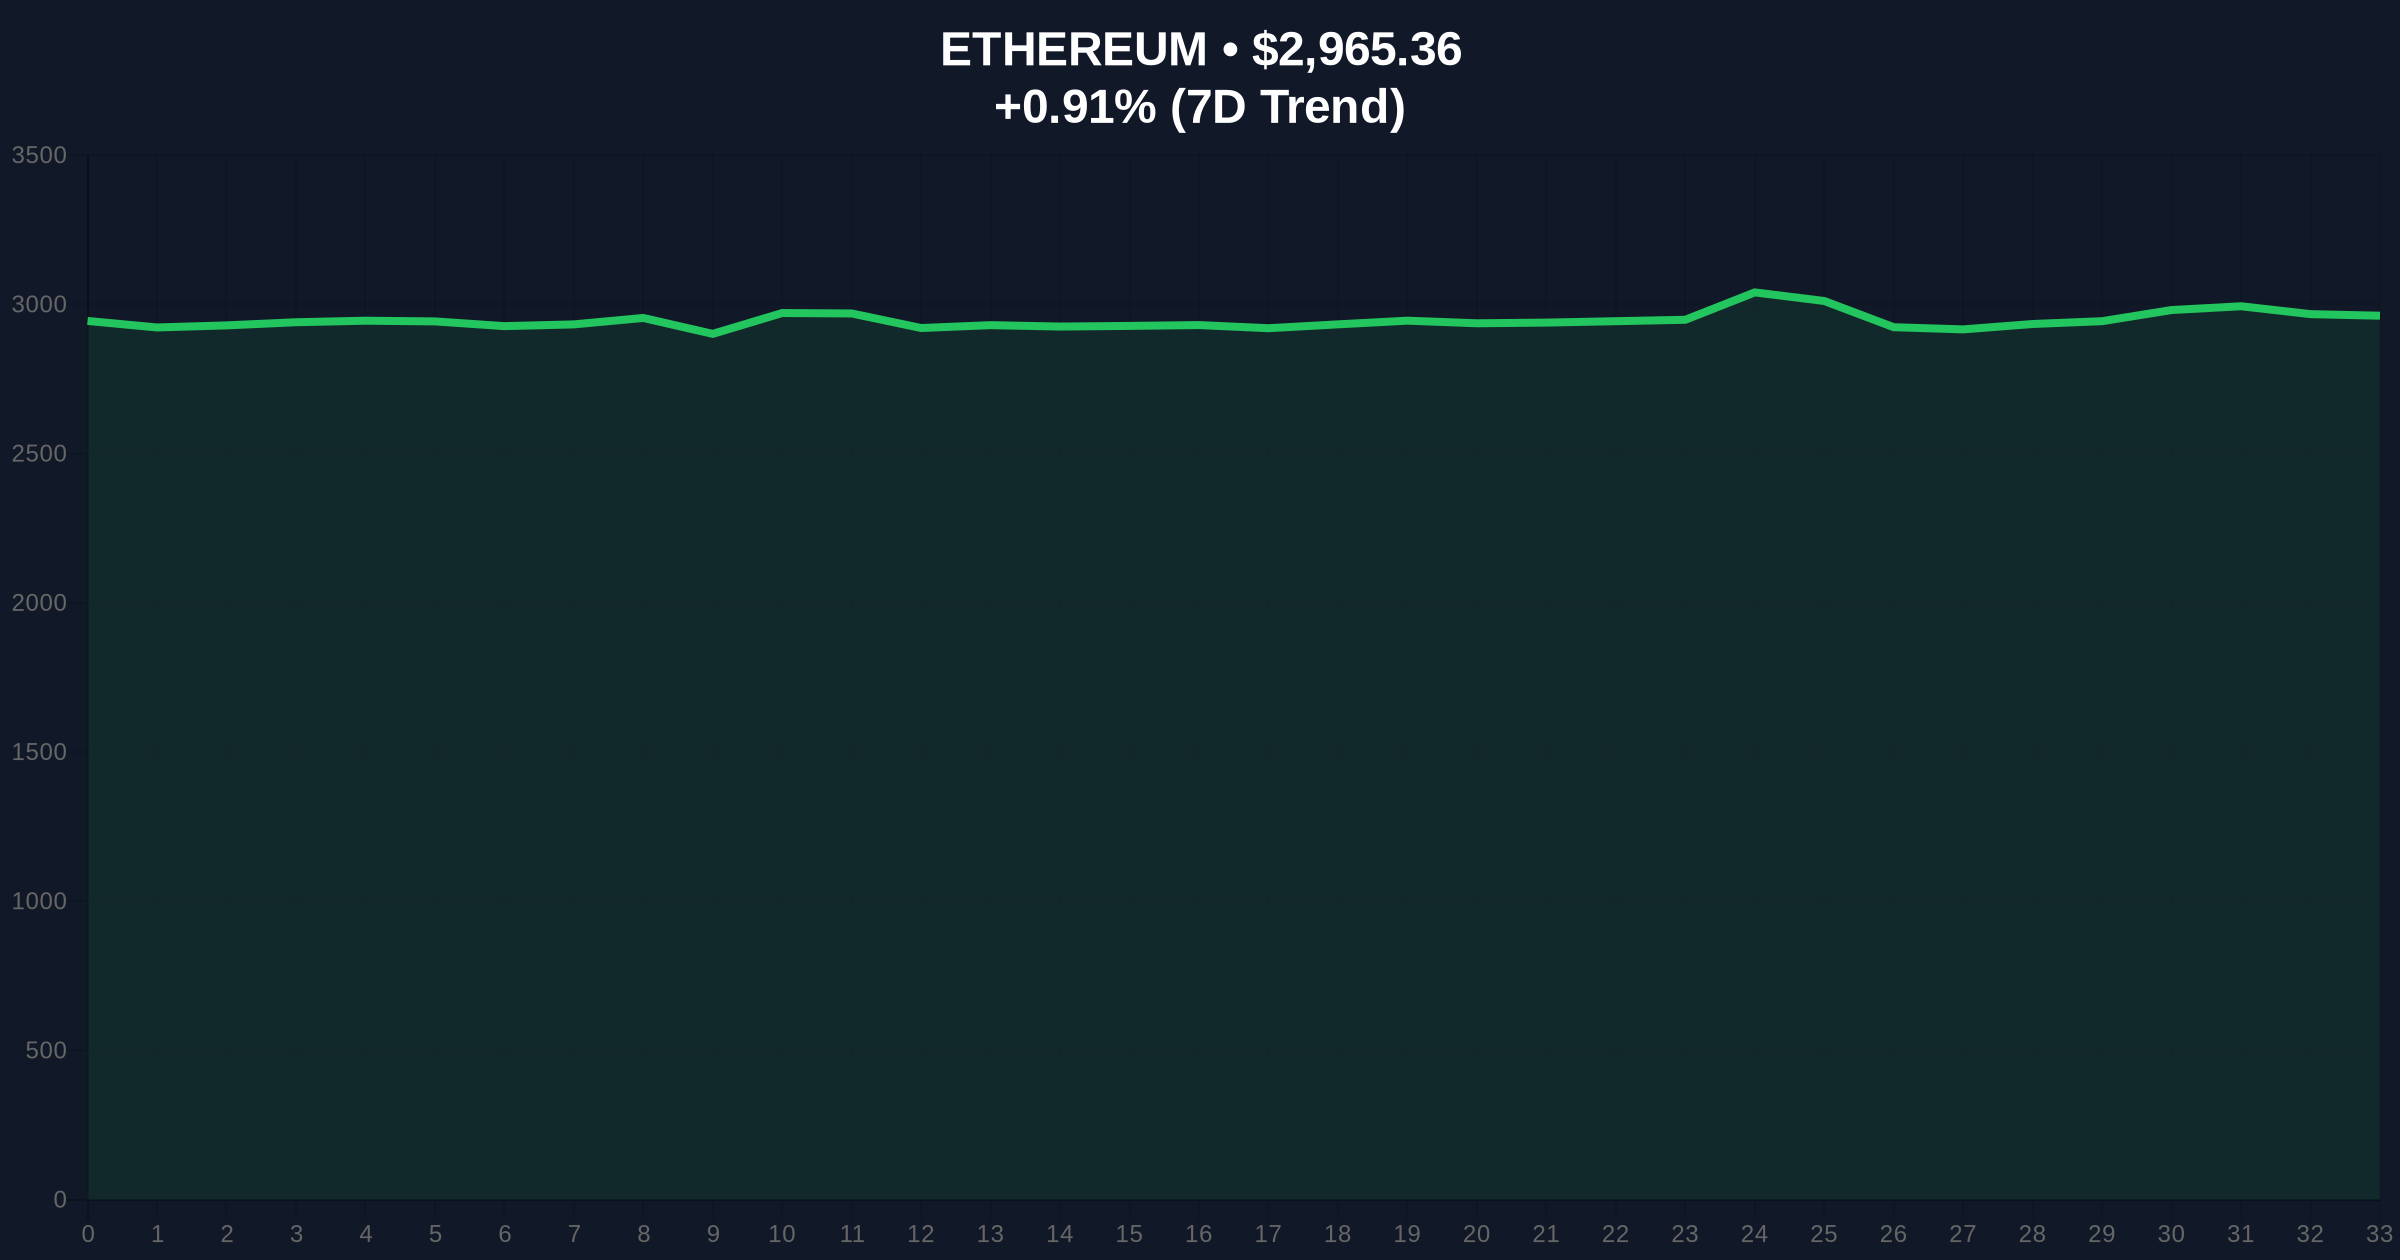
Ethereum is currently trading at $2,965.89, up 0.93% over the past 24 hours. The 50-day moving average sits at $3,150, creating immediate resistance, while the 200-day moving average provides support at $2,850. The Relative Strength Index (RSI) reads 42, indicating neither overbought nor oversold conditions. A critical Fibonacci support level exists at $2,800, representing the 0.618 retracement from the 2024 highs. Volume profile analysis shows significant accumulation between $2,900 and $3,000, suggesting this range represents a fair value gap (FVG) that institutional flows are attempting to fill.
Bullish Invalidation Level: A sustained break below $2,800 would invalidate the current accumulation thesis and suggest further downside toward $2,600.
Bearish Invalidation Level: A decisive close above $3,200 would negate the current resistance structure and open the path toward $3,500.
| Metric | Value |
|---|---|
| Net Inflows (Dec. 30) | $67.84 million |
| Grayscale ETHE Inflows | $50.19 million |
| Current ETH Price | $2,965.89 |
| 24-Hour Price Change | +0.93% |
| Crypto Fear & Greed Index | 21/100 (Extreme Fear) |
For institutional investors, this inflow reversal signals potential bottom formation in Ethereum's price structure. The concentration of flows into Grayscale products suggests sophisticated capital is positioning for a medium-term recovery, possibly anticipating regulatory clarity around Ethereum's classification following recent SEC developments. For retail traders, the extreme fear environment combined with institutional accumulation creates a classic contrarian setup where sentiment extremes often precede trend reversals. The five-day outflow streak ending suggests selling pressure has been exhausted at current levels, potentially setting the stage for a gamma squeeze if options market positioning aligns with spot accumulation.
Market analysts on social platforms note the divergence between extreme fear sentiment and institutional inflows. One quantitative trader observed, "When ETF flows reverse during fear extremes, it typically marks local bottoms." Another analyst highlighted the technical significance, stating, "The $2,900 level represents a major order block that institutions are defending." Bulls point to Ethereum's upcoming network upgrades, including potential enhancements to scalability through EIP-4844, as fundamental drivers that could support higher valuations once market sentiment normalizes.
Bullish Case: If the current inflow trend continues and Ethereum holds above the $2,800 Fibonacci support, price could retest the $3,200 resistance level within 2-4 weeks. Sustained institutional accumulation combined with improving market sentiment could drive Ethereum toward $3,500 by Q1 2026, representing approximately 18% upside from current levels.
Bearish Case: If the inflow reversal proves temporary and Ethereum breaks below $2,800, the next significant support sits at $2,600. Continued extreme fear sentiment combined with macroeconomic headwinds could push Ethereum toward $2,400, representing approximately 19% downside from current levels. The bearish scenario would be confirmed by a resumption of ETF outflows and declining on-chain activity metrics.
Source Note: Market data and factual reporting in this article are sourced from original reports. Commentary and analysis provided by CoinMarketBuzz.

Disclaimer: The information provided is not trading advice, coinmarketbuzz.com holds no liability for any investments made based on the information provided on this page. We strongly recommend independent research and/or consultation with a qualified professional before making any investment decisions.
coinmarketbuzz.com leverages advanced AI technology to analyze market data. All content is fact-checked and reviewed by our editorial team to ensure accuracy and neutrality.