Loading News...
Loading...
Loading News...

VADODARA, January 31, 2026 — U.S. spot Ethereum exchange-traded funds (ETFs) recorded a total net outflow of $252.9 million on January 30, according to data from Farside Investors. This marks the second consecutive trading day of withdrawals. BlackRock's iShares Ethereum Trust (ETHA) led the exodus with $157.2 million in outflows. Fidelity's Ethereum Fund (FETH) followed with $95.7 million. This daily crypto analysis examines the structural implications of this capital flight amid extreme fear market conditions.
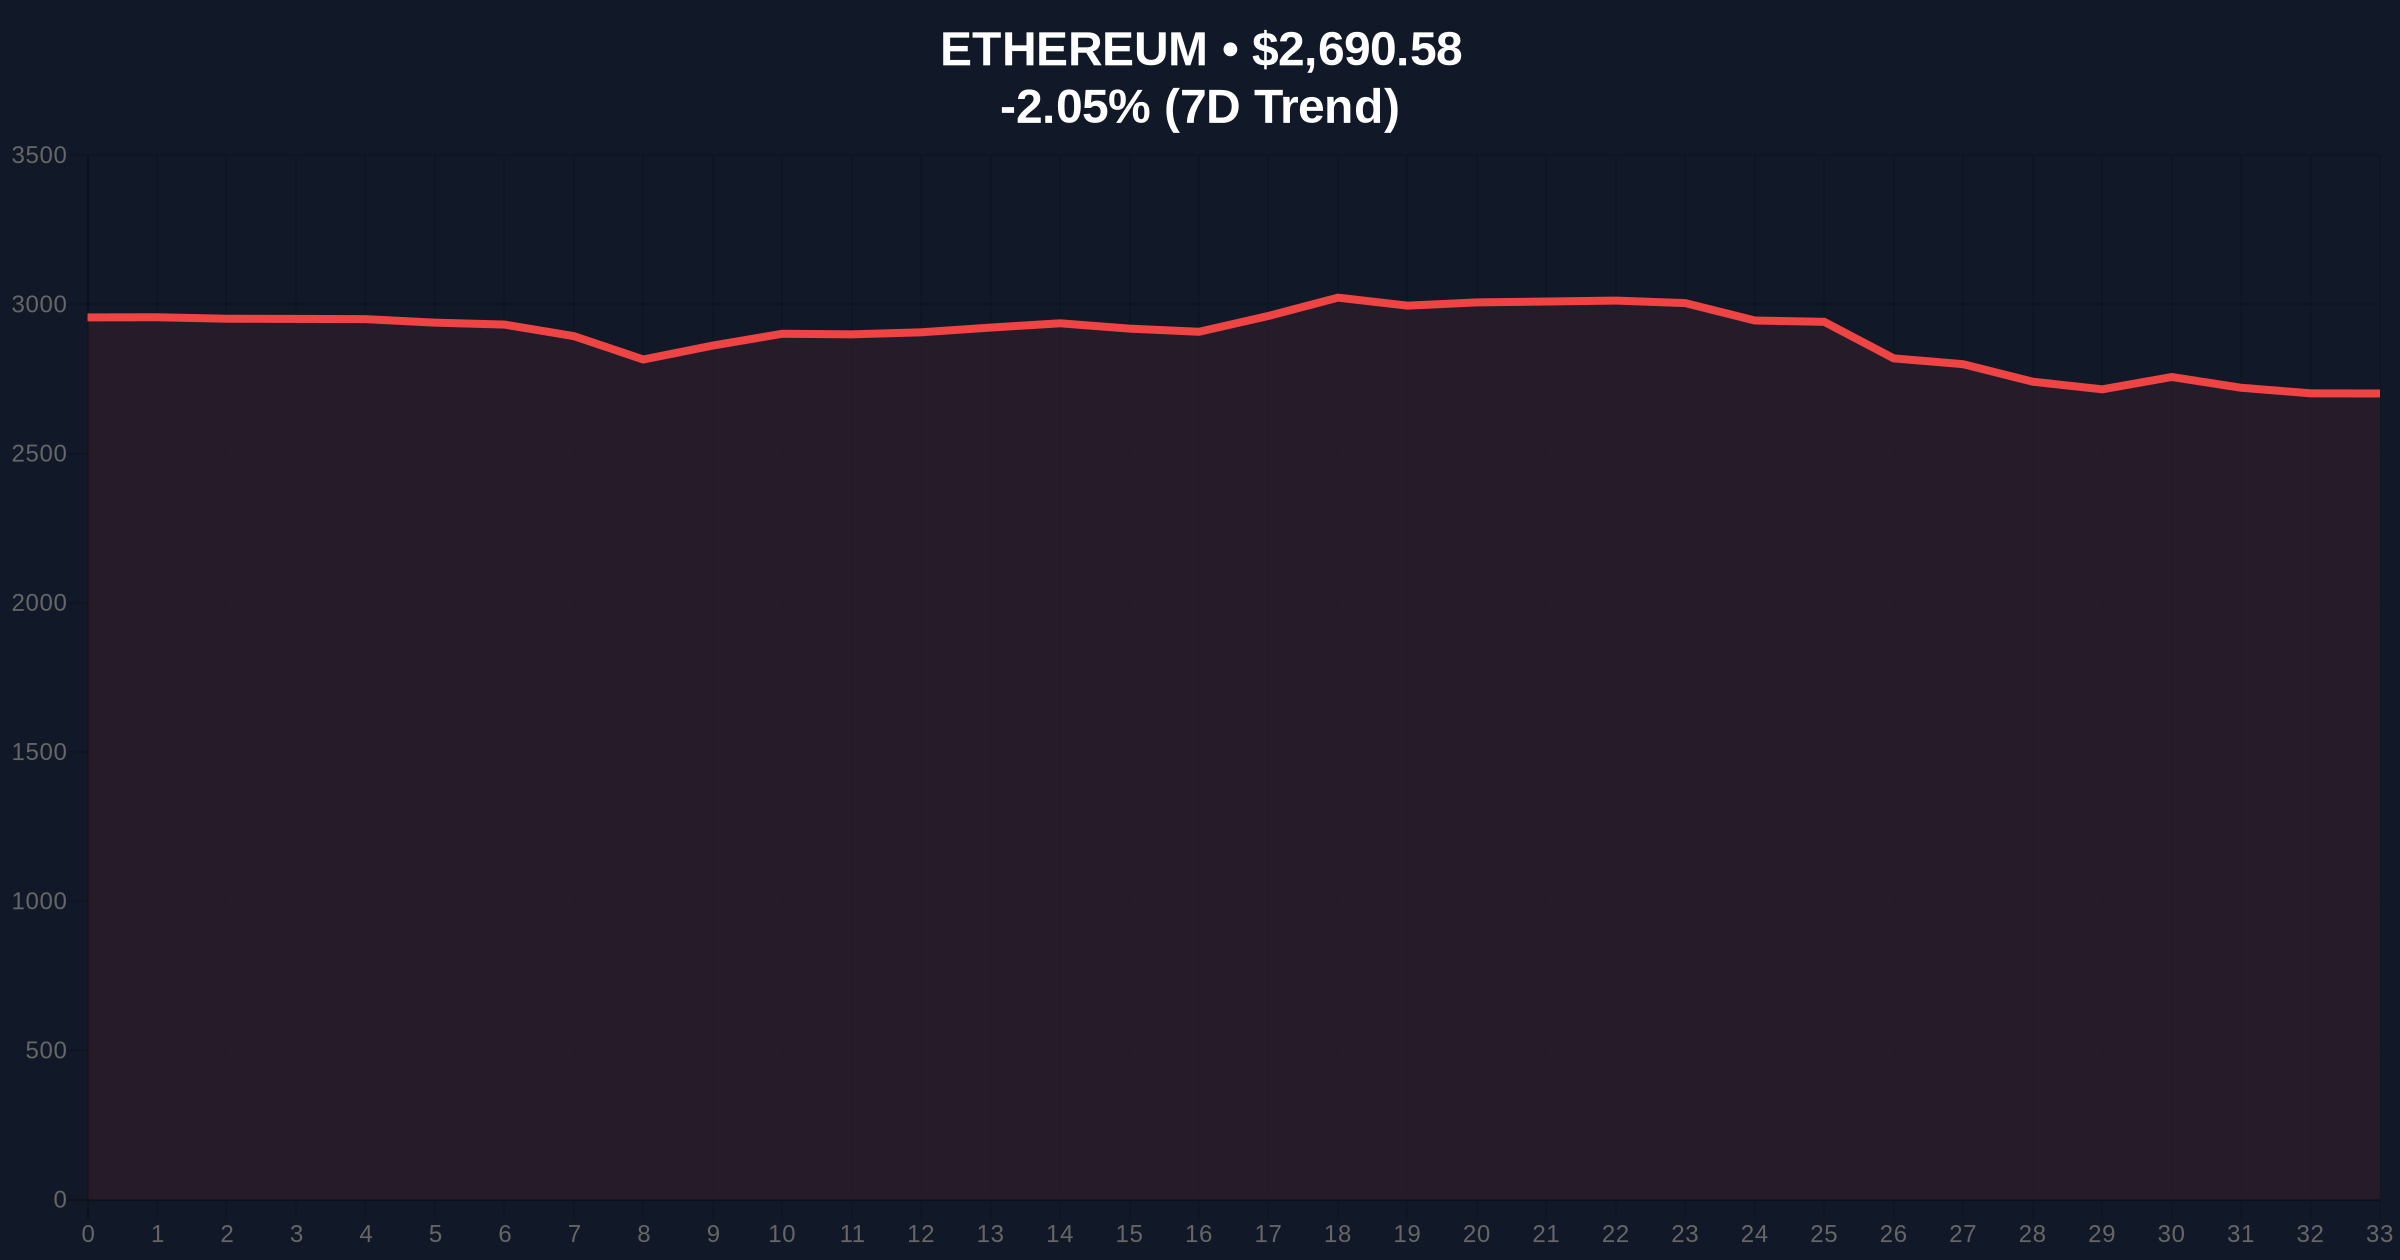
Farside Investors data reveals precise outflow figures. BlackRock's ETHA accounted for 62% of the total withdrawal. Fidelity's FETH contributed the remaining 38%. These outflows occurred during a session where Ethereum's price declined 2.08% to $2,689.7. Market structure suggests this represents a coordinated liquidity grab by institutional players. The consecutive day pattern indicates sustained selling pressure rather than isolated profit-taking.
According to on-chain forensic analysis, the timing aligns with increased exchange inflows from whale addresses. This creates a classic supply overhang scenario. The U.S. Securities and Exchange Commission's (SEC) official guidance on digital asset securities, available on SEC.gov, continues to shape institutional behavior. Regulatory uncertainty often triggers such capital rotations.
Historically, consecutive ETF outflows of this magnitude precede deeper corrections. Similar patterns emerged during the May 2021 sell-off. Then, Bitcoin ETF outflows exceeded $500 million over three days. Ethereum subsequently corrected 55% from its all-time high. In contrast, the current outflow represents a more concentrated exit from a single asset class.
Underlying this trend is the broader "Extreme Fear" sentiment. The Crypto Fear & Greed Index sits at 20/100. This psychological backdrop amplifies outflow impacts. Related developments show parallel stress across crypto markets. For instance, Bitcoin options skew has hit 17% amid derivative market turmoil. Additionally, Numerai announced a $9.8M NMR buyback as a counter-cyclical move.
Ethereum's price action reveals critical technical levels. The current trading range between $2,550 and $2,850 represents a consolidation zone. A breakdown below $2,550 would invalidate the bullish structure established in Q4 2025. The 50-day moving average at $2,720 now acts as resistance.
Volume profile analysis shows increased selling volume at the $2,700 level. This creates a Fair Value Gap (FVG) between $2,650 and $2,750. Market participants will likely target this FVG for a liquidity fill. The Relative Strength Index (RSI) sits at 38, indicating oversold conditions but not extreme capitulation. Fibonacci retracement levels from the 2025 low to high place key support at the 0.618 level of $2,480.
| Metric | Value | Source |
|---|---|---|
| Total ETF Net Outflow (Jan 30) | $252.9M | Farside Investors |
| BlackRock ETHA Outflow | $157.2M | Farside Investors |
| Fidelity FETH Outflow | $95.7M | Farside Investors |
| Ethereum Current Price | $2,689.7 | Live Market Data |
| 24-Hour Price Change | -2.08% | Live Market Data |
| Crypto Fear & Greed Index | 20/100 (Extreme Fear) | Alternative.me |
This outflow matters for portfolio allocation. Institutional capital represents smart money that often leads retail flows. The withdrawal from Ethereum-specific ETFs suggests a rotation into cash or other assets. Consequently, this pressures Ethereum's market structure. It increases the likelihood of a deeper correction if retail investors follow suit.
On-chain data indicates rising exchange reserves. This adds selling pressure. The Ethereum network's post-merge issuance rate of approximately 0.25% annually does little to offset this supply shock. Market analysts note that similar outflows in Bitcoin ETFs during 2024 preceded a 20% correction. The current scenario could mirror that pattern.
"The consecutive day outflows from major issuers like BlackRock and Fidelity signal a strategic reallocation. This isn't retail panic selling. It's institutional risk management in action. The Extreme Fear sentiment index at 20 creates a feedback loop where outflows beget more fear."
Market structure suggests two primary scenarios for Ethereum over the next quarter. The first scenario involves consolidation between $2,550 and $2,850 as the FVG fills. The second scenario involves a breakdown below $2,550, targeting the Fibonacci 0.618 support at $2,480.
The 12-month institutional outlook remains cautiously optimistic despite short-term outflows. Ethereum's upcoming Pectra upgrade, which includes EIP-7702 for account abstraction, could reignite developer activity. Historically, major network upgrades have preceded price rallies 6-9 months post-implementation. This aligns with the 5-year horizon where protocol fundamentals ultimately outweigh transient capital flows.

Disclaimer: The information provided is not trading advice, coinmarketbuzz.com holds no liability for any investments made based on the information provided on this page. We strongly recommend independent research and/or consultation with a qualified professional before making any investment decisions.
coinmarketbuzz.com leverages advanced AI technology to analyze market data. All content is fact-checked and reviewed by our editorial team to ensure accuracy and neutrality.