Loading News...
Loading...
Loading News...

VADODARA, January 7, 2026 — U.S. spot Bitcoin exchange-traded funds (ETFs) recorded a total net outflow of $240 million on January 6, according to data compiled by TraderT, marking a reversal from two consecutive days of net inflows. This daily crypto analysis examines whether this represents a liquidity grab by institutions or the beginning of a deeper correction phase.
Market structure suggests ETF flows have become a leading indicator for Bitcoin price action since their January 2024 approval. According to historical cycles, consecutive outflow days typically precede 5-7% corrections as institutional capital rotates. The current outflow follows a period where Bitcoin failed to break above the $95,500 resistance level, creating a Fair Value Gap (FVG) between $92,000 and $94,000. This technical pattern often attracts liquidity grabs from algorithmic traders. Related developments include contrasting flows in other crypto products, such as US spot Ethereum ETFs seeing sustained inflows, suggesting capital rotation rather than broad crypto abandonment.
According to TraderT's compiled data, BlackRock's IBIT was the sole fund to record an inflow of $231.89 million, while outflows dominated other major issuers. Fidelity's FBTC led with $312.24 million in outflows, followed by Grayscale's GBTC at $83.07 million. Grayscale's Mini BTC saw $32.73 million exit, with Ark Invest's ARKB and VanEck's HODL recording outflows of $29.47 million and $14.38 million respectively. This distribution indicates concentrated selling pressure from specific institutional players rather than broad-based retail redemption.
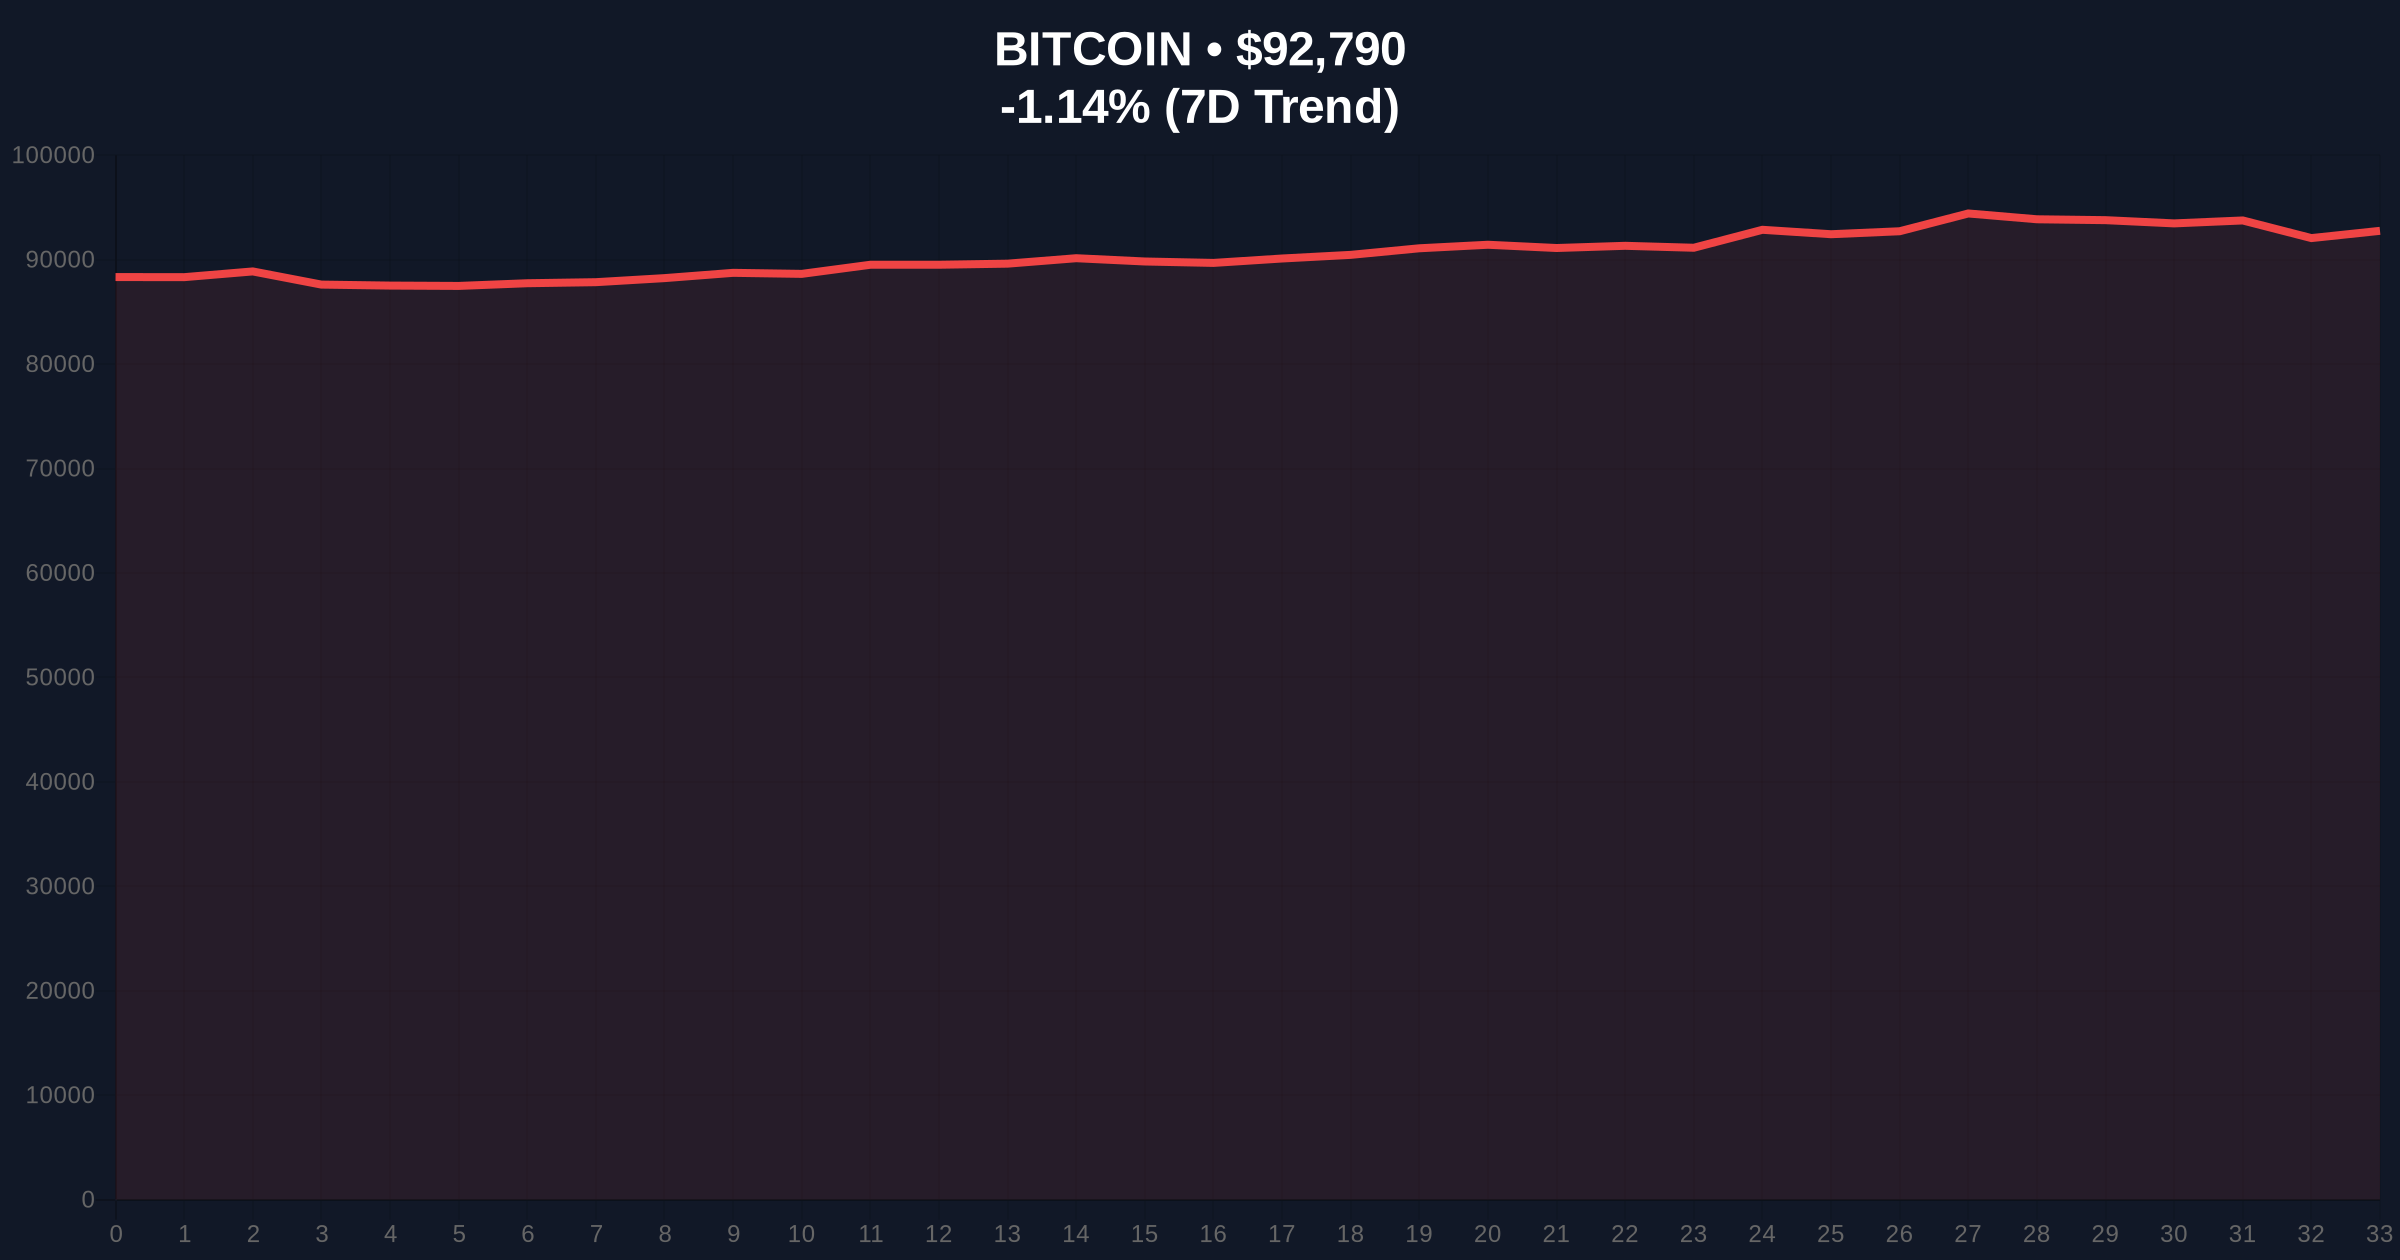
On-chain data indicates Bitcoin's current price of $92,761 sits at a critical Volume Profile Point of Control (POC) level. The 24-hour trend of -1.17% reflects weakening momentum as the Relative Strength Index (RSI) approaches oversold territory at 42. Market structure suggests the $90,000 level represents a major Order Block from December 2025 accumulation, while resistance clusters around $95,500 based on Fibonacci extensions from the 2024-2025 rally. The Bullish Invalidation level is set at $88,500—a break below would invalidate the current uptrend structure. The Bearish Invalidation level stands at $96,200, where a sustained move above would signal renewed institutional accumulation.
| Metric | Value |
|---|---|
| Total ETF Net Outflow (Jan 6) | $240 million |
| Bitcoin Current Price | $92,761 |
| 24-Hour Price Change | -1.17% |
| Crypto Fear & Greed Index | Fear (42/100) |
| Largest Single Outflow (FBTC) | $312.24 million |
| Only Inflow (IBIT) | $231.89 million |
This development matters because ETF flows directly impact Bitcoin's liquidity profile. Institutional outflows of this magnitude typically correlate with increased selling pressure on centralized exchanges, as documented in SEC filings regarding market impact assessments. For retail investors, the fear sentiment reading of 42/100 suggests potential buying opportunities if support holds, but continued outflows could trigger a Gamma Squeeze scenario where derivatives positions amplify downward momentum. The concentration in Fidelity's outflow particularly warrants scrutiny, as their execution patterns often precede broader institutional moves.
Market analysts on X/Twitter are divided. Bulls point to BlackRock's continued inflow as evidence of "smart money" accumulation during weakness, suggesting this is a temporary liquidity grab. Bears highlight the aggregate outflow exceeding inflow as confirmation of profit-taking after Bitcoin's 150% rally since Q3 2025. Neither camp disputes the technical significance of the $90,000 support level, with most awaiting the weekly close for confirmation.
Bullish Case: If Bitcoin holds above $90,000 and ETF flows reverse to net positive by January 9, market structure suggests a retest of $95,500 resistance. This scenario requires BlackRock's inflows to continue outpacing other outflows, creating a net positive liquidity effect. Historical patterns indicate such reversals typically gain 8-12% within two weeks.
Bearish Case: Should outflows continue for three consecutive days and Bitcoin breaks $88,500, the Fair Value Gap between $85,000 and $87,000 becomes the next target. This would align with the Crypto Fear & Greed Index dropping below 30, potentially triggering a 15-20% correction to test the 200-day moving average near $82,000.
Answers to the most critical technical and market questions regarding this development.

Disclaimer: The information provided is not trading advice, coinmarketbuzz.com holds no liability for any investments made based on the information provided on this page. We strongly recommend independent research and/or consultation with a qualified professional before making any investment decisions.
coinmarketbuzz.com leverages advanced AI technology to analyze market data. All content is fact-checked and reviewed by our editorial team to ensure accuracy and neutrality.