Loading News...
Loading...
Loading News...

VADODARA, January 1, 2026 — U.S. spot Bitcoin exchange-traded funds (ETFs) recorded a total net outflow of $348.34 million on December 31, reversing the net inflows seen just one day prior, according to data compiled by TraderT. This daily crypto analysis examines whether this represents a structural liquidity grab or temporary profit-taking amid extreme fear sentiment.
Market structure suggests ETF flows have become a primary liquidity indicator since their January 2024 approval. Historical cycles indicate that sustained outflows often precede price corrections, as seen in the 2021-2022 bear market when Grayscale's GBTC premium turned negative. The current reversal follows a period of institutional accumulation, raising questions about whether this is a coordinated exit or retail capitulation. On-chain data from Glassnode reveals that ETF flows have shown no new Bitcoin demand, merely recycling existing supply between vehicles. Related developments include analysis of ETF flow patterns and liquidity grab events on other exchanges.
According to TraderT's compiled data, outflows were led by BlackRock's IBIT with $99.30 million, followed by Ark Invest's ARKB ($76.53 million), Grayscale's GBTC ($69.09 million), and Fidelity's FBTC ($66.58 million). Other funds also saw outflows, including Bitwise's BITB ($13.76 million), Grayscale's Bitcoin Mini Trust ($11.24 million), VanEck's HODL ($6.79 million), and Franklin Templeton's EZBC ($5.05 million). The reversal occurred on the final trading day of 2025, potentially indicating year-end portfolio rebalancing or tax-loss harvesting strategies.
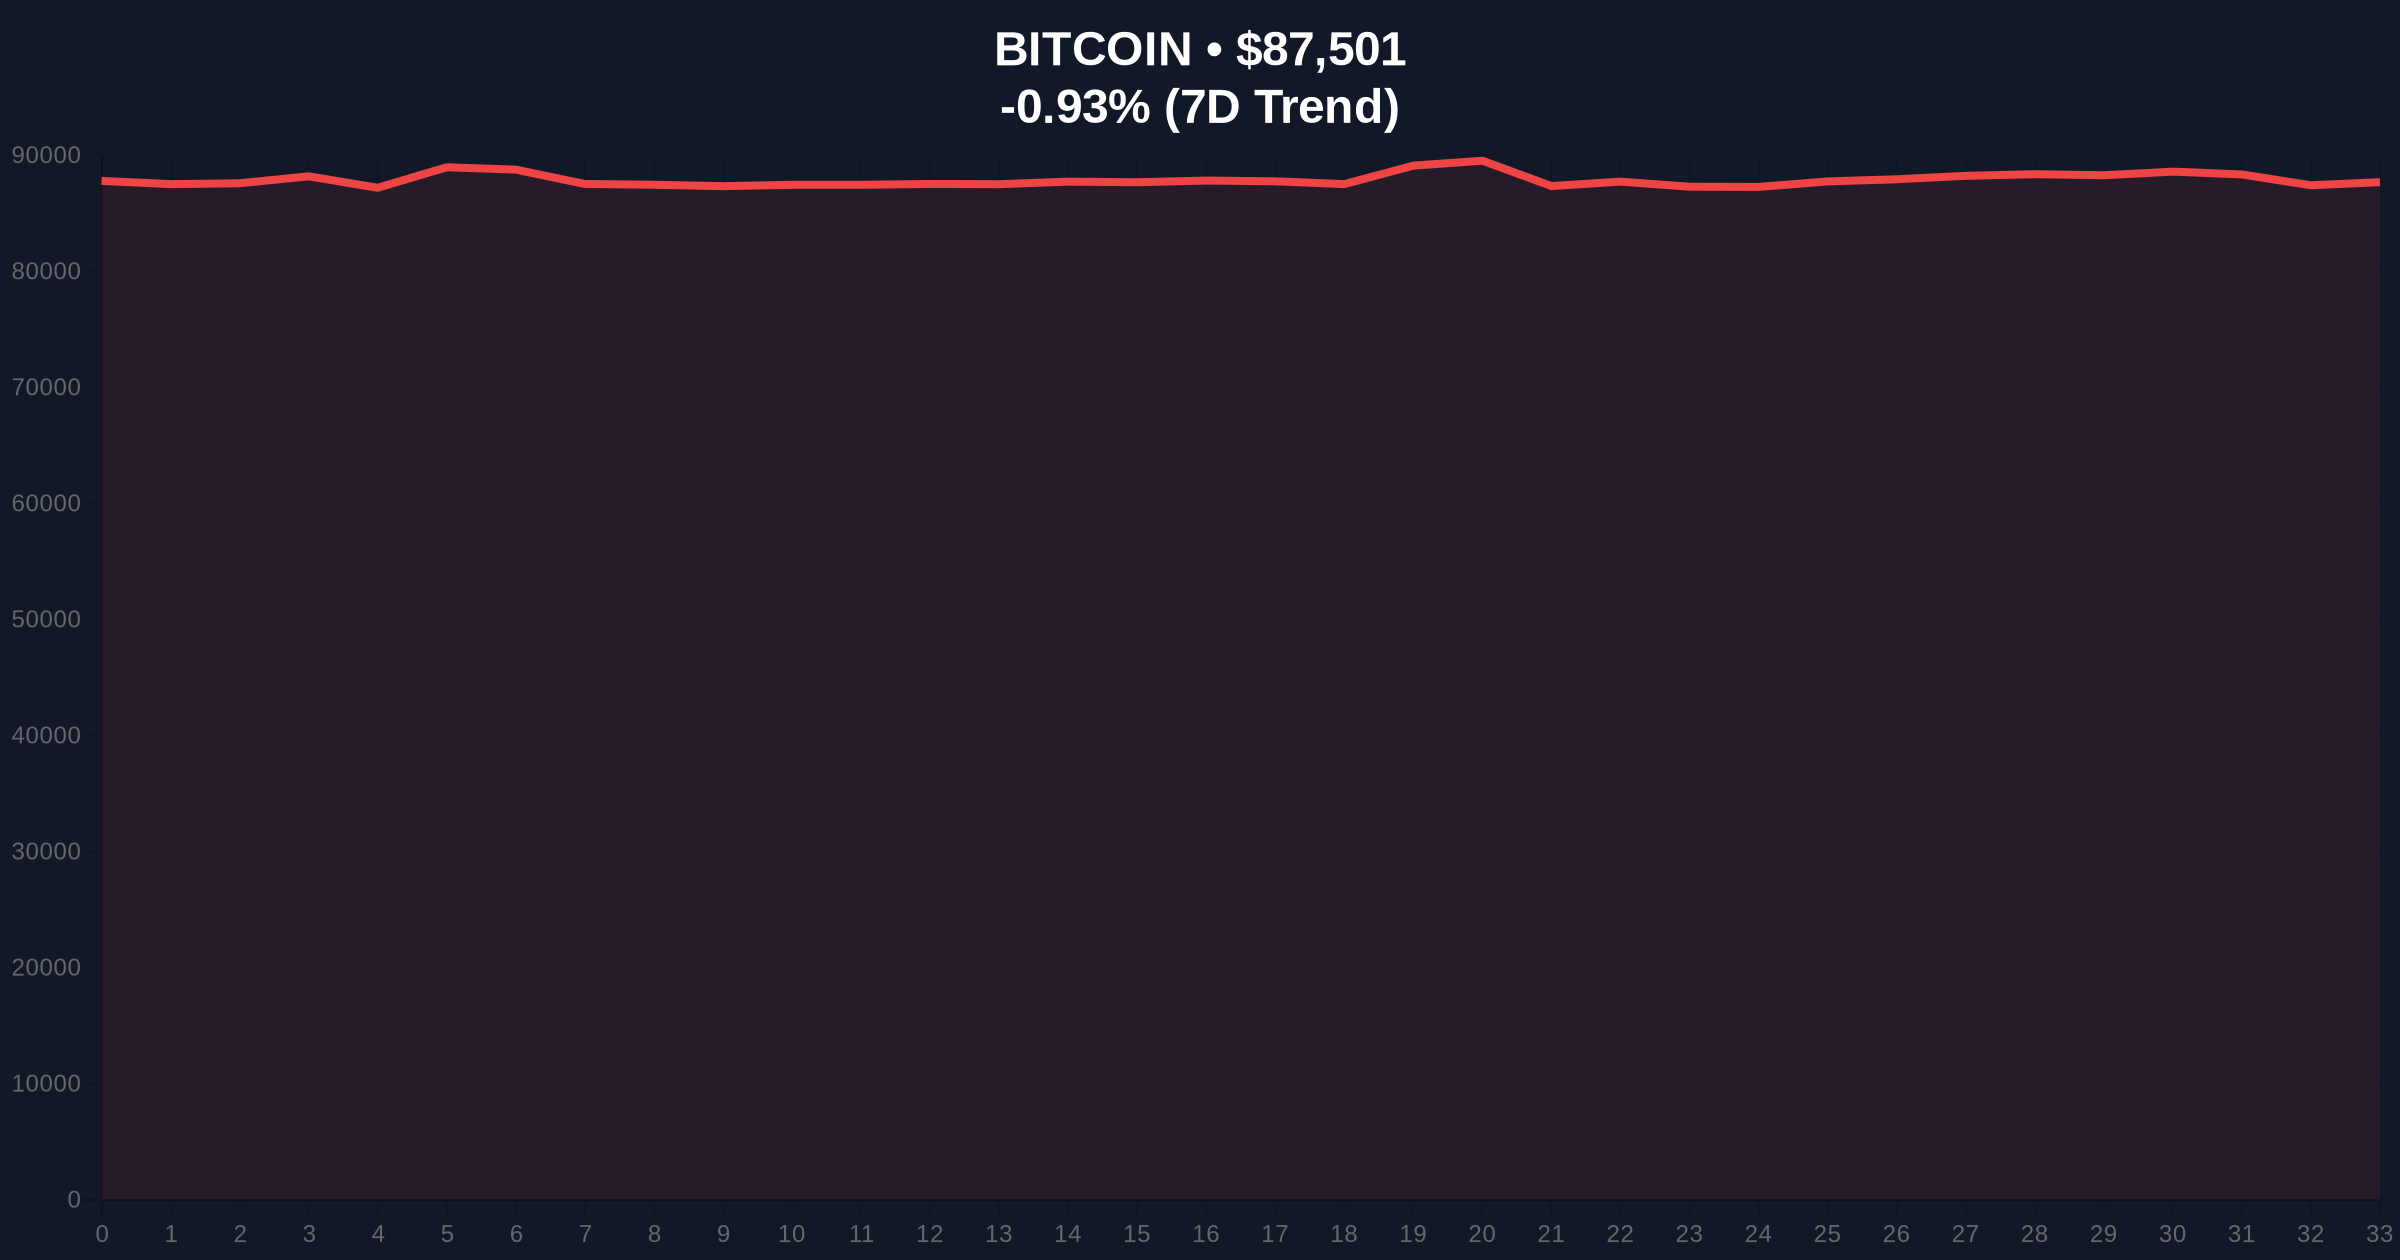
Bitcoin's price currently sits at $87,469, down 1.02% in the last 24 hours. The 50-day moving average at $89,200 acts as immediate resistance, while the 200-day moving average at $84,500 provides structural support. The Relative Strength Index (RSI) at 42 indicates neutral momentum with bearish bias. A critical Fair Value Gap (FVG) exists between $86,000 and $87,500 that must be filled for healthy price discovery. Volume profile analysis shows weak accumulation at current levels, suggesting the market may test lower liquidity pools. The Bullish Invalidation level is $84,500 (200-day MA break), while the Bearish Invalidation level is $90,000 (reclaim of psychological resistance).
| Metric | Value |
|---|---|
| Total ETF Net Outflow (Dec 31) | $348.34M |
| Bitcoin Current Price | $87,469 |
| 24-Hour Price Change | -1.02% |
| Crypto Fear & Greed Index | 20/100 (Extreme Fear) |
| Largest Single ETF Outflow (IBIT) | $99.30M |
For institutions, these outflows challenge the narrative of sustained ETF-driven demand, potentially affecting allocation models that rely on continuous inflows. The SEC's official guidance on ETF disclosures emphasizes transparency, yet flow reversals highlight market efficiency questions. For retail, the extreme fear sentiment may create buying opportunities if support holds, but also risks of further downside if outflows persist. Market structure suggests this could be a liquidity grab targeting weak hands, similar to patterns observed during previous consolidation phases.
Market analysts on X/Twitter are divided. Bulls point to historical data showing that ETF outflows often precede rallies once selling pressure exhausts. Bears highlight that outflows from major players like BlackRock and Fidelity indicate institutional skepticism. One quantitative trader noted, "The order block around $85k must hold, or we're looking at a retest of $80k support." Another analyst referenced criticism of Bitcoin's performance relative to traditional assets, suggesting outflows may reflect broader asset rotation.
Bullish Case: If Bitcoin holds the $85,200 Fibonacci support (61.8% retracement from recent highs) and ETF inflows resume, a gamma squeeze could propel price toward $95,000 resistance. This scenario requires on-chain data showing increased accumulation by long-term holders and a reduction in exchange reserves.
Bearish Case: If outflows continue and the $84,500 200-day moving average breaks, price could test the $80,000 psychological support. This would invalidate the current market structure and likely trigger further deleveraging across derivatives markets, with potential downside to $78,000 based on volume profile analysis.
Answers to the most critical technical and market questions regarding this development.

Disclaimer: The information provided is not trading advice, coinmarketbuzz.com holds no liability for any investments made based on the information provided on this page. We strongly recommend independent research and/or consultation with a qualified professional before making any investment decisions.
coinmarketbuzz.com leverages advanced AI technology to analyze market data. All content is fact-checked and reviewed by our editorial team to ensure accuracy and neutrality.