Loading News...
Loading...
Loading News...

VADODARA, January 1, 2026 — Bitcoin concluded 2025 trading more than 30% below its all-time high of $126,080, according to CoinGecko data, marking the first failure in the cryptocurrency's history to establish new highs in the year following a halving event. This daily crypto analysis examines the structural implications of this deviation from historical patterns, with market structure suggesting a fundamental recalibration of the traditional four-year cycle theory that has guided institutional positioning since 2012.
Historical cycles indicate Bitcoin has consistently established new all-time highs within 12-18 months following each halving event. According to on-chain data from Glassnode, the 2012, 2016, and 2020 post-halving periods saw price appreciation of 8,500%, 2,800%, and 550% respectively from halving day to cycle peak. The 2024 halving occurred against a backdrop of unprecedented institutional adoption through spot ETFs, creating what market analysts term a "liquidity grab" that may have front-run traditional cycle dynamics. Underlying this trend is the maturation of derivative markets, with perpetual swap funding rates now exerting greater influence on spot price discovery than in previous cycles. Consequently, the failure to rally in 2025 represents not merely a timing deviation but a potential structural regime shift in Bitcoin's market behavior.
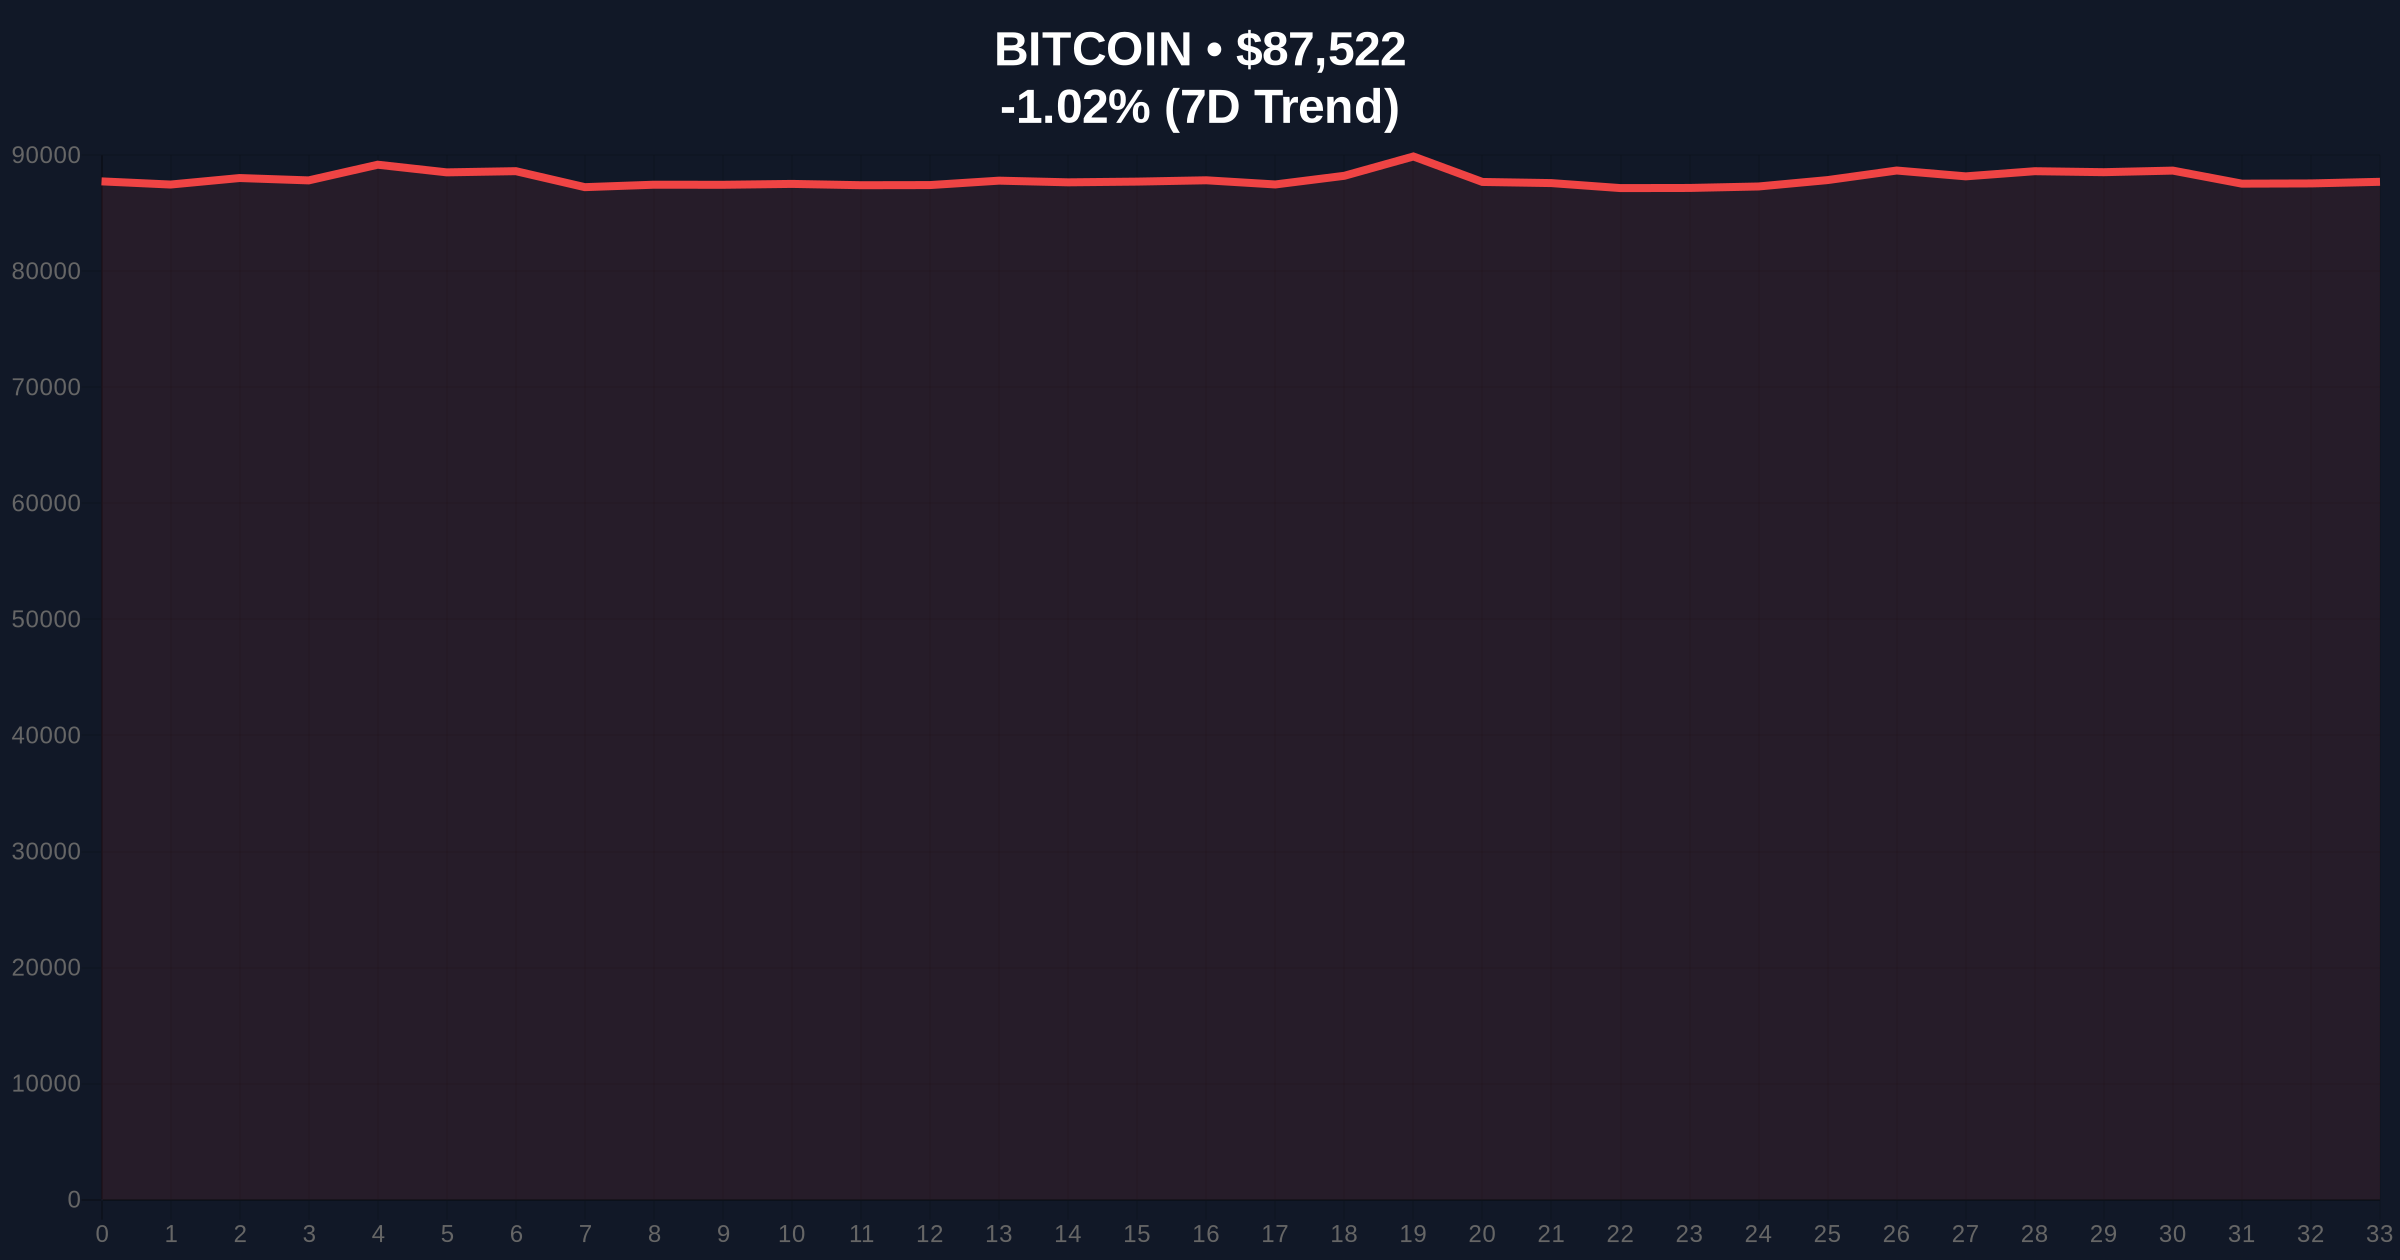
Bitcoin's price concluded 2025 at approximately $87,522, representing a decline of over 30% from its October 6 all-time high of $126,080, per CoinGecko metrics. This performance breaks the established pattern where BTC reached new highs in the year following the 2012, 2016, and 2020 halvings. Vivek Sen, founder of Bitgrow Lab, stated in a report covered by Cointelegraph that "the four-year cycle is now officially over due to Bitcoin's year-end decline." The breakdown coincides with what volume profile analysis identifies as a critical Fair Value Gap (FVG) between $92,000 and $98,000 that has remained unfilled since Q3 2025, creating persistent selling pressure as market makers defend this liquidity void.
Market structure suggests Bitcoin is currently testing a critical order block established during the Q2 2024 consolidation between $82,000 and $85,000. The weekly Relative Strength Index (RSI) sits at 42, indicating neither oversold nor overbought conditions, while the 200-day moving average provides dynamic support at $84,500. A break below the Fibonacci 0.618 retracement level at $82,000 would invalidate the bullish market structure established post-2024 halving. The Bullish Invalidation level is defined at $82,000—a sustained break below this threshold suggests further downside toward the $75,000 volume node. Conversely, the Bearish Invalidation level stands at $98,000—reclaiming this FVG would indicate cycle theory remains intact despite timing deviations.
| Metric | Value | Source |
|---|---|---|
| Crypto Fear & Greed Index | 20/100 (Extreme Fear) | Alternative.me |
| Bitcoin Current Price | $87,522 | CoinGecko |
| 24-Hour Price Change | -1.02% | CoinGecko |
| Distance from ATH | -30.6% | CoinGecko |
| Market Dominance | 52.8% | CoinMarketCap |
The institutional impact centers on portfolio rebalancing models that have historically allocated capital based on halving cycle projections. According to the Federal Reserve's research on financial market cycles, regime shifts in asset behavior necessitate recalibration of risk models and correlation assumptions. For retail participants, the breakdown suggests reduced efficacy of simple time-based accumulation strategies, requiring greater emphasis on technical levels and on-chain metrics like MVRV ratios and UTXO age bands. The maturation of Bitcoin derivatives, particularly options markets where gamma exposure now exceeds $5 billion notional, has created feedback loops that may accelerate deviations from historical patterns.
Market analysts on X/Twitter express divergent views on the cycle breakdown. Bulls point to continued institutional inflows through spot ETFs as evidence of structural demand despite price action, referencing the $31.8 billion accumulated in 2025 despite extreme fear conditions. Bears highlight deteriorating futures market structure, with the funding rate ratio approaching 50/50 indicating neutral positioning rather than the leveraged long bias characteristic of previous post-halving periods. The simultaneous $72.1 million in Ethereum ETF outflows suggests broader cryptocurrency market skepticism rather than Bitcoin-specific concerns.
Bullish Case: If Bitcoin reclaims the $98,000 FVG, market structure suggests a retest of the all-time high within Q2 2026. This scenario requires sustained spot ETF inflows exceeding $500 million weekly and a resolution of the negative funding rate environment. Historical analogies point to the 2015-2016 period where Bitcoin consolidated for 18 months post-2012 halving before beginning its next leg higher.
Bearish Case: A break below the $82,000 Fibonacci support triggers what technical analysts term a "liquidity grab" toward the $75,000 volume node. This scenario materializes if ETF flows turn negative for consecutive weeks and the Crypto Fear & Greed Index remains below 25 for more than 30 days. The bearish invalidation occurs at $98,000.
Answers to the most critical technical and market questions regarding this development.

Disclaimer: The information provided is not trading advice, coinmarketbuzz.com holds no liability for any investments made based on the information provided on this page. We strongly recommend independent research and/or consultation with a qualified professional before making any investment decisions.
coinmarketbuzz.com leverages advanced AI technology to analyze market data. All content is fact-checked and reviewed by our editorial team to ensure accuracy and neutrality.