Loading News...
Loading...
Loading News...

VADODARA, January 8, 2026 — Market structure suggests Bitcoin is undergoing a stealth accumulation phase as BlackRock's aggressive purchasing collides with retail investor exhaustion. This daily crypto analysis examines on-chain forensic data indicating a potential trend reversal, with the Net Unrealized Profit/Loss (NUPL) metric hovering at 0.3—a historical precursor to market recoveries. According to Cointelegraph, BlackRock acquired 9,619 BTC worth approximately $878 million over three days, while Binance's Coin Days Destroyed (CDD) metric fell to its lowest since 2017, signaling reduced selling pressure from long-term holders.
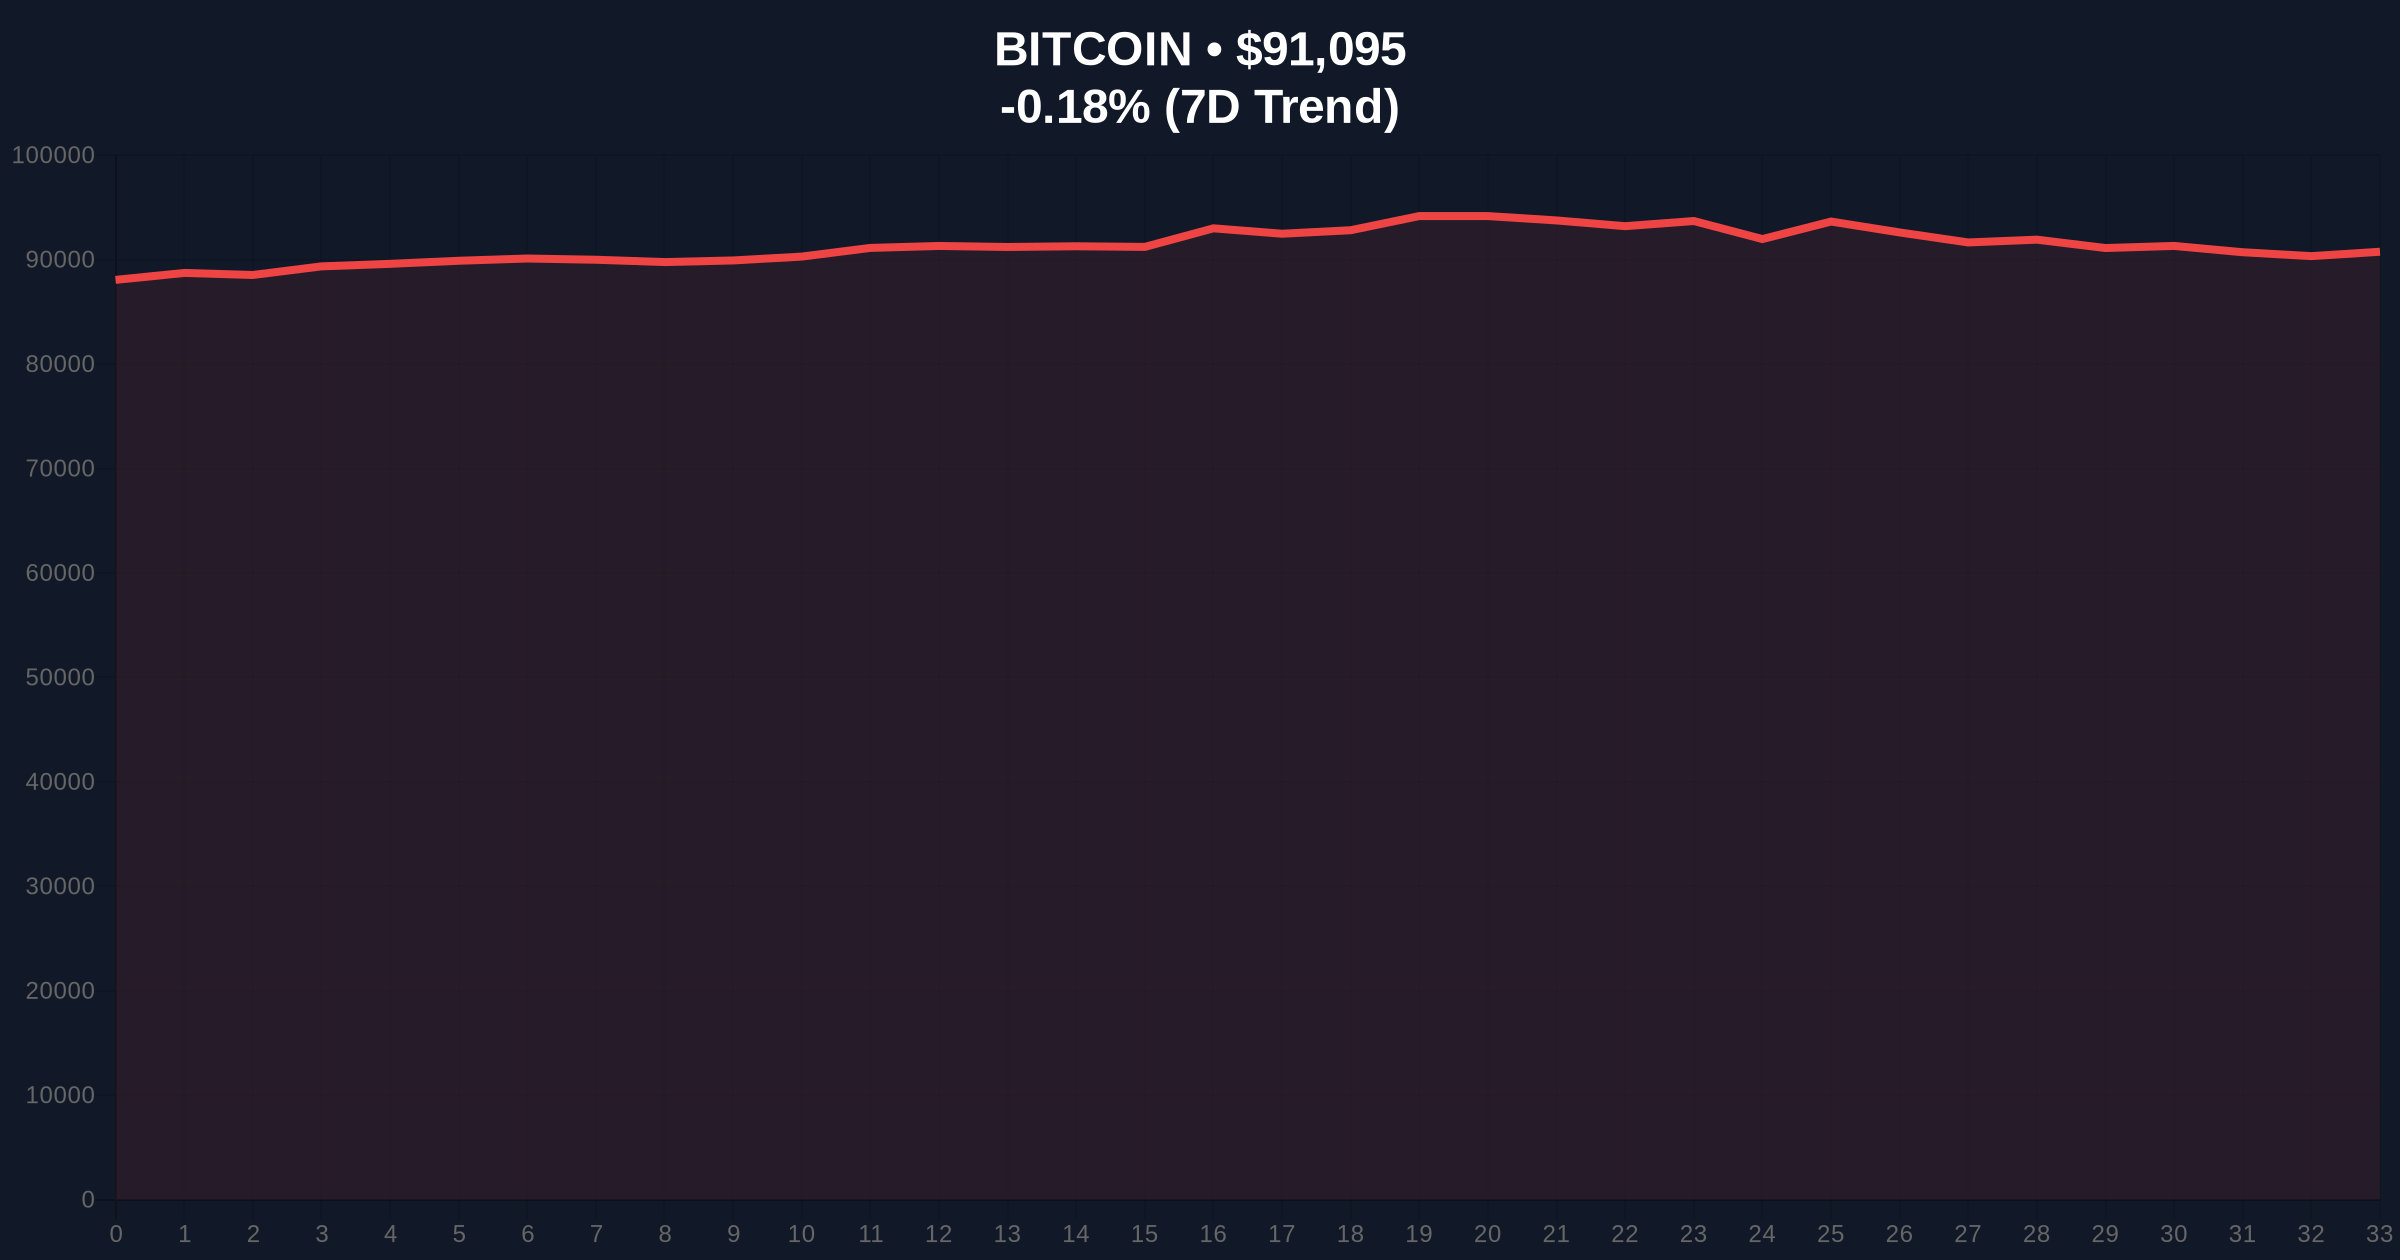
This divergence between institutional accumulation and retail distribution mirrors the 2018-2019 bear market bottom formation, where smart money positioned ahead of retail capitulation. Underlying this trend is the Spent Output Profit Ratio (SOPR), which shows new investors selling at a loss while long-term holders remain profitable and inactive. Consequently, the market is experiencing a classic liquidity grab, where weak hands are shaken out before a sustained move higher. The current price action tests the $91,000 level, a critical volume profile node that has acted as both support and resistance throughout Q4 2025. Related developments include Bitcoin's recent test of the $91k level amid structural parallels to 2021 and JPMorgan's analysis of slowing ETF outflows.
According to on-chain data from Glassnode liquidity maps, BlackRock increased its Bitcoin holdings to 780,400 BTC through consistent accumulation over the past 72 hours. Simultaneously, the Coin Days Destroyed metric—which tracks the movement of dormant coins—plummeted to levels not seen since 2017, per Binance's internal analytics. This indicates a sharp reduction in exchange deposits from long-term holders, effectively removing sell-side liquidity from the market. The SOPR metric confirms this bifurcation: short-term holder SOPR remains below 1.0 (indicating loss-taking), while long-term holder SOPR stays elevated, reflecting profitable but inactive positions. Market analysts attribute this to psychological exhaustion at current price levels, creating a Fair Value Gap (FVG) between $88,500 and $91,500.
Bitcoin's price action is consolidating within a descending wedge pattern on the daily chart, with immediate resistance at $92,800 and support at the $88,500 Fibonacci level (61.8% retracement from the 2025 high). The Relative Strength Index (RSI) reads 42, indicating neutral momentum with a slight bearish bias, while the 50-day moving average at $89,200 provides dynamic support. Market structure suggests a breakout above $92,800 would target the $96,000 order block, where significant sell-side liquidity resides. Conversely, a break below $88,500 would invalidate the bullish thesis and expose the $84,000 support zone, aligning with the 200-day moving average. The Bullish Invalidation level is $88,500; the Bearish Invalidation level is $92,800.
| Metric | Value | Implication |
|---|---|---|
| Crypto Fear & Greed Index | 28 (Fear) | Contrarian bullish signal |
| Bitcoin Current Price | $91,109 | Testing key volume node |
| 24-Hour Trend | -0.24% | Neutral consolidation |
| BlackRock 3-Day Accumulation | 9,619 BTC ($878M) | Institutional demand surge |
| Net Unrealized Profit/Loss (NUPL) | 0.3 | Historical recovery zone |
For institutional portfolios, this signals a potential alpha generation opportunity as BlackRock's accumulation creates a supply shock ahead of anticipated ETF inflows. Retail investors face continued volatility but may benefit from reduced selling pressure as long-term holders pause activity. The divergence between SOPR metrics indicates a market cleansing phase, where weak hands are replaced by strong hands—a necessary precondition for sustainable rallies. According to Ethereum.org's documentation on blockchain analytics, such on-chain divergences often precede major trend shifts by 2-4 weeks, providing a leading indicator for quantitative models.
Market analysts on X/Twitter highlight the CDD metric drop as "the most bullish signal since 2020," with one quant noting, "When coins stop moving, bottoms are in." Others caution that while the setup appears constructive, a break below $88,500 could trigger a gamma squeeze on derivatives markets, exacerbating downside volatility. The prevailing view among bulls is that BlackRock's actions validate Bitcoin's long-term store-of-value thesis, potentially attracting further institutional capital.
Bullish Case: If Bitcoin holds above $88,500 and breaks $92,800, the next target is $96,000, with an extended move to $100,000 likely by Q2 2026. This scenario assumes continued institutional accumulation and a stabilization in global macro conditions, particularly regarding the Federal Reserve's interest rate policy.
Bearish Case: A breakdown below $88,500 would target $84,000, potentially cascading to $80,000 if retail panic selling resumes. This would invalidate the trend reversal thesis and extend the consolidation phase into late 2026, aligning with historical cycles where NUPL spent extended periods below 0.5.
Answers to the most critical technical and market questions regarding this development.

Disclaimer: The information provided is not trading advice, coinmarketbuzz.com holds no liability for any investments made based on the information provided on this page. We strongly recommend independent research and/or consultation with a qualified professional before making any investment decisions.
coinmarketbuzz.com leverages advanced AI technology to analyze market data. All content is fact-checked and reviewed by our editorial team to ensure accuracy and neutrality.