Loading News...
Loading...
Loading News...

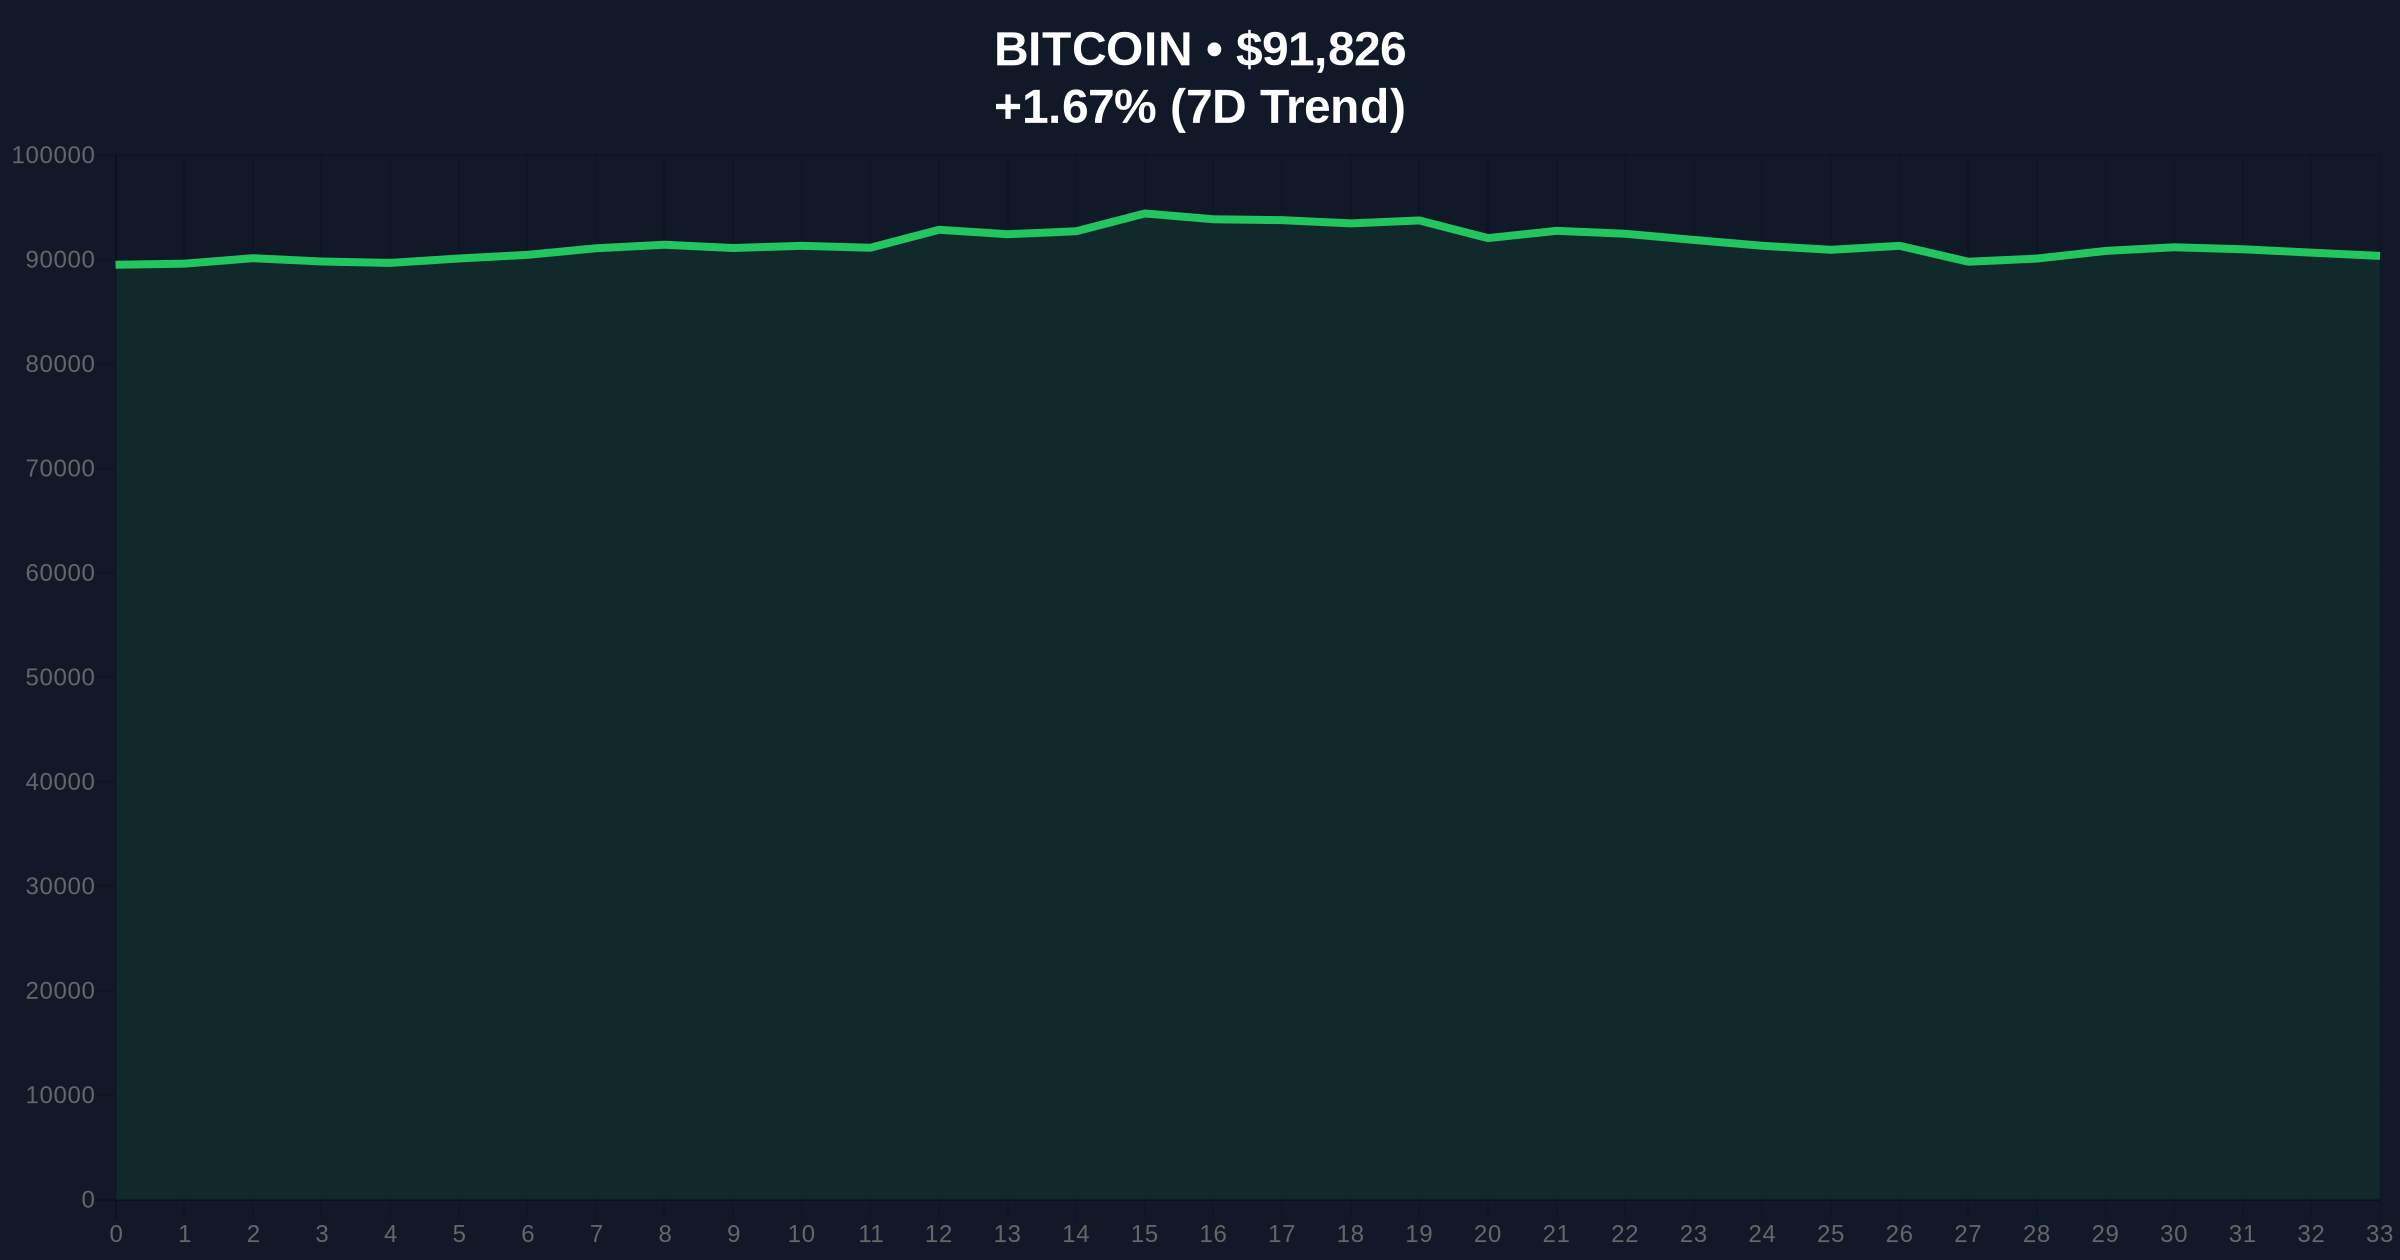
VADODARA, January 9, 2026 — According to CoinNess market monitoring data, Bitcoin has broken above the $92,000 psychological barrier, trading at $92,019.4 on the Binance USDT market. This Bitcoin price action occurs against a backdrop of extreme fear sentiment, creating a market structure anomaly that demands quantitative scrutiny.
Market structure suggests this move represents a classic liquidity grab above previous resistance levels. The current price action mirrors the 2021 cycle where Bitcoin broke above key psychological levels despite negative sentiment readings. According to historical on-chain data from Glassnode, such divergences between price and sentiment have typically preceded either explosive moves or sharp reversals within 2-3 weeks. The Federal Reserve's monetary policy stance, detailed in their official FOMC calendar, continues to influence macro liquidity conditions that affect Bitcoin's correlation with traditional risk assets.
Related Developments:
On January 9, 2026, Bitcoin price action surged through the $92,000 level according to real-time data from CoinNess. The asset reached an intraday high of $92,019.4 on Binance's USDT pairing, representing a 1.68% gain over the previous 24 hours. This move occurred despite the Crypto Fear & Greed Index registering an extreme fear reading of 27/100, creating what quantitative analysts term a sentiment-price divergence. Market structure indicates this breakout has created a Fair Value Gap (FVG) between $91,200 and $91,800 that will likely be filled in subsequent price action.
Volume profile analysis reveals significant accumulation between $90,500 and $91,000, creating a strong order block that now serves as critical support. The 50-day exponential moving average sits at $89,200, while the 200-day simple moving average provides structural support at $85,400. Relative Strength Index (RSI) readings at 62 suggest moderate bullish momentum without entering overbought territory. Market structure suggests the $93,500 level represents the next major resistance, corresponding with the 0.618 Fibonacci extension from the previous correction.
Bullish Invalidation Level: A sustained break below the $90,500 order block would invalidate the current bullish structure, potentially triggering a retest of the $88,000 support zone.
Bearish Invalidation Level: A weekly close above $93,500 with increasing volume would confirm the breakout's validity and target the $95,000-$96,000 resistance cluster.
| Metric | Value | Significance |
|---|---|---|
| Current Price | $91,828 | Real-time trading level |
| 24-Hour Change | +1.68% | Short-term momentum |
| Crypto Fear & Greed Index | 27/100 (Fear) | Extreme sentiment divergence |
| Market Rank | #1 | Dominance position |
| Key Support Zone | $90,500-$91,000 | Critical order block |
For institutional investors, this breakout represents a potential gamma squeeze scenario where short positions above $92,000 face increasing pressure. The contradiction between price strength and extreme fear sentiment creates asymmetric risk opportunities for quantitative funds employing mean-reversion strategies. Retail traders face different implications: the Fair Value Gap between $91,200 and $91,800 suggests high probability of a pullback to fill this liquidity void before continuation. Market structure indicates this move tests whether algorithmic trading systems will interpret the sentiment-price divergence as a buying opportunity or distribution signal.
Market analysts on X/Twitter express skepticism about the sustainability of this move given the extreme fear reading. One quantitative trader noted, "Price action above $92k with fear at 27 suggests either massive institutional accumulation or a bull trap." Another analyst pointed to on-chain data indicating reduced exchange reserves as a potentially bullish signal despite the sentiment reading. The dominant narrative questions whether this represents genuine demand or a liquidity grab to trigger stop losses above previous resistance.
Bullish Case: If Bitcoin maintains above the $91,000 order block with increasing volume, market structure suggests a test of $93,500 resistance within 7-10 days. A break above this level could trigger a gamma squeeze targeting the $95,000-$96,000 zone. This scenario requires sustained institutional inflow and resolution of the sentiment-price divergence through fear decreasing as price consolidates.
Bearish Case: If the Fair Value Gap between $91,200 and $91,800 fills aggressively, market structure indicates a retest of the $90,500 support. A break below this level would likely trigger a liquidation cascade toward the $88,000 support zone. This scenario becomes more probable if the extreme fear sentiment persists and translates into selling pressure rather than contrarian buying opportunity.
Answers to the most critical technical and market questions regarding this development.

Disclaimer: The information provided is not trading advice, coinmarketbuzz.com holds no liability for any investments made based on the information provided on this page. We strongly recommend independent research and/or consultation with a qualified professional before making any investment decisions.
coinmarketbuzz.com leverages advanced AI technology to analyze market data. All content is fact-checked and reviewed by our editorial team to ensure accuracy and neutrality.