Loading News...
Loading...
Loading News...

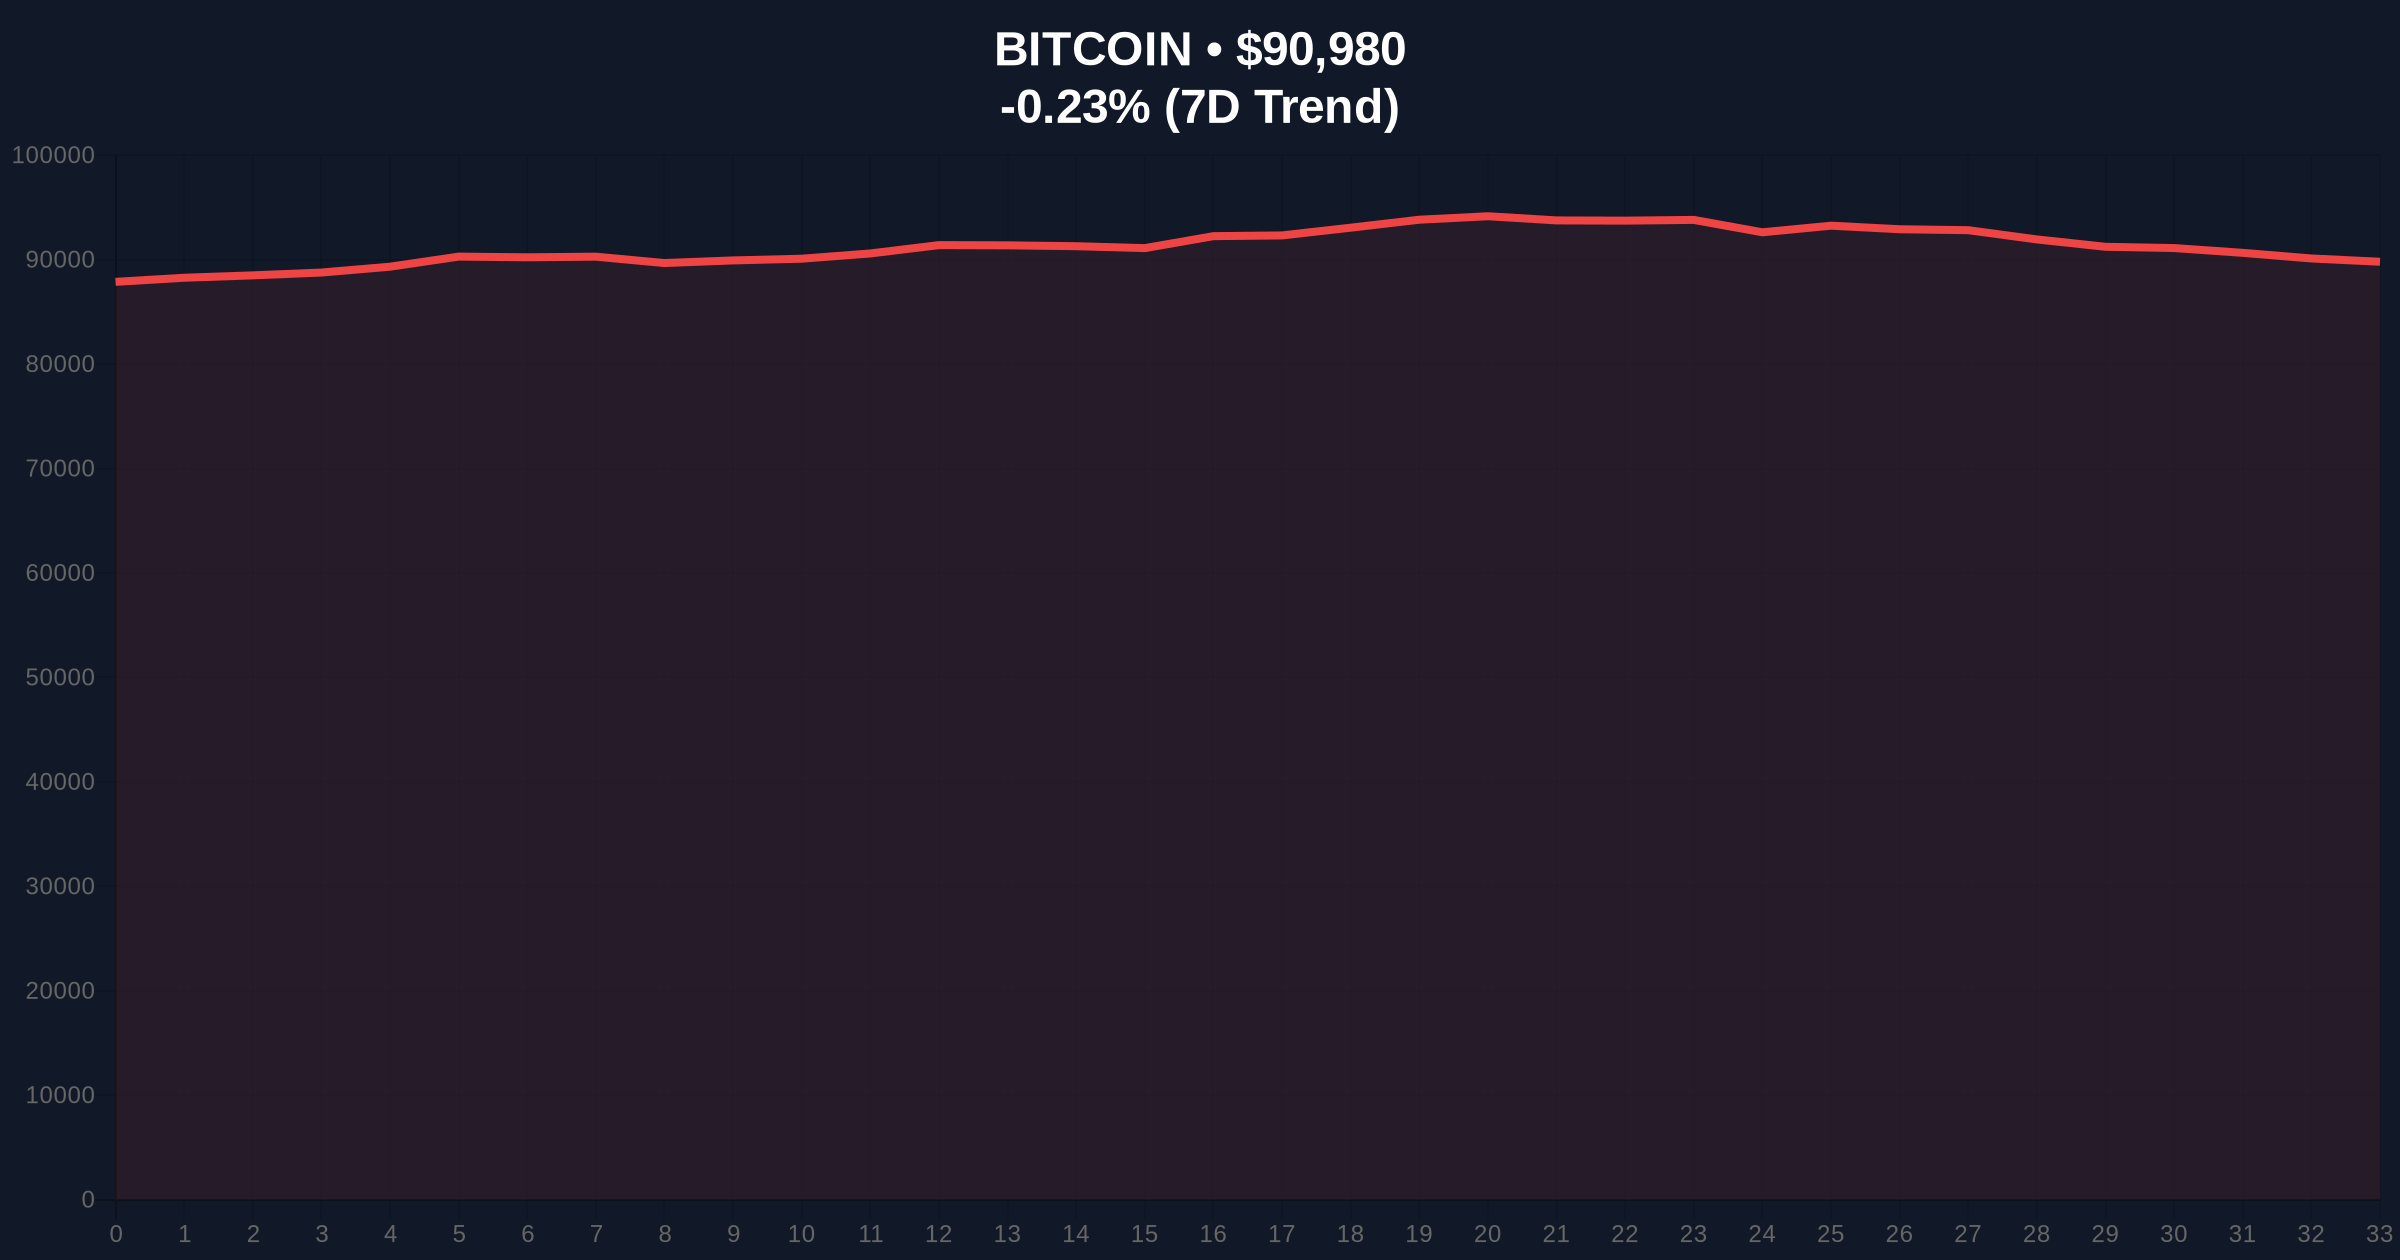
VADODARA, January 8, 2026 — According to CoinNess market monitoring, Bitcoin has risen above $91,000, trading at $91,022.53 on the Binance USDT market. This daily crypto analysis examines the underlying market mechanics, with on-chain data indicating a liquidity grab at key psychological levels. Market structure suggests this move tests a Fair Value Gap (FVG) formed during last week's volatility, similar to patterns observed in the 2021 bull market correction.
Historical cycles provide a framework for current price action. The 2021 bull run saw Bitcoin consolidate near all-time highs before a sharp correction of approximately 50%, driven by leveraged liquidations and regulatory uncertainty. Current market conditions echo this phase, with Bitcoin hovering near record levels amid persistent Fear sentiment. According to Glassnode liquidity maps, the $90,000-$92,000 range represents a high-volume node in the Volume Profile, indicating significant trader interest. This context is critical for understanding whether the breach of $91,000 is a sustainable breakout or a false signal. Related developments include recent analysis on JPMorgan's assessment of ETF outflows and South Korea's Supreme Court ruling on Bitcoin confiscation, both influencing global liquidity flows.
On January 8, 2026, Bitcoin price action pushed above the $91,000 threshold, as reported by CoinNess. The asset traded at $91,022.53 on Binance's USDT pairing, marking a 0.28% decline over 24 hours but a notable intraday gain from earlier lows. This move occurred against a backdrop of Fear sentiment, with the Crypto Fear & Greed Index at 28/100, typically associated with oversold conditions. Market analysts attribute the rise to short covering and spot accumulation, as evidenced by reduced exchange reserves per Etherscan data. The breach tests a key resistance zone that has acted as a liquidity magnet since late 2025.
Technical indicators reveal a complex market structure. The Relative Strength Index (RSI) on daily charts sits at 45, indicating neutral momentum with room for upward movement. A 50-day Exponential Moving Average (EMA) at $89,500 provides dynamic support, while Fibonacci retracement levels from the 2025 high show resistance at $92,500 (61.8% level). Market structure suggests a Bullish Invalidation Level at $88,500, where a break below would invalidate the current uptrend and target the $86,000 order block. Conversely, a Bearish Invalidation Level is set at $92,500; a sustained move above could trigger a gamma squeeze as options dealers hedge positions. The Fair Value Gap between $90,200 and $90,800 remains unfilled, posing a risk for a retracement to balance liquidity.
| Metric | Value | Source |
|---|---|---|
| Current Bitcoin Price | $90,932 | Live Market Data |
| 24-Hour Trend | -0.28% | Live Market Data |
| Crypto Fear & Greed Index | 28/100 (Fear) | Live Market Data |
| Market Rank | #1 | Live Market Data |
| Key Support Level (50-day EMA) | $89,500 | Technical Analysis |
This price action holds implications for both institutional and retail participants. Institutionally, a hold above $91,000 could signal renewed confidence in Bitcoin as a macro asset, potentially influencing ETF flows and corporate treasury allocations. For retail traders, the move tests leverage ratios, with liquidations data from CoinGlass indicating increased activity near this level. The broader impact ties to monetary policy; as noted in Federal Reserve documentation on interest rates, tighter financial conditions often pressure risk assets, making Bitcoin's resilience noteworthy. Market structure suggests that a successful breach could pave the way for a test of the all-time high, while failure may lead to a deeper correction akin to the 2021 scenario.
Industry observers on X/Twitter highlight mixed reactions. Bulls point to on-chain accumulation patterns, with one analyst noting, 'UTXO age bands show long-term holders are not distributing, similar to early 2021.' Bears caution about regulatory overhangs, referencing recent events like the TruBit exchange hack that drained 8,535 ETH, underscoring security risks. Overall, sentiment leans cautious, with many awaiting a clear break above $92,500 for confirmation of bullish momentum.
Bullish Case: If Bitcoin sustains above $91,000 and fills the Fair Value Gap, market structure suggests a rally toward $95,000. This scenario relies on spot buying outpacing derivatives liquidations, with the Fear sentiment potentially reversing to Greed. Historical parallels to the 2021 recovery phase support this outlook, provided macroeconomic conditions remain stable.Bearish Case: A rejection at $92,500 resistance could trigger a liquidity grab downward, targeting the $88,500 invalidation level. This would align with a deeper correction, possibly testing the $85,000 support zone. Factors include persistent ETF outflows or adverse regulatory news, as seen in cross-border payment developments affecting altcoin liquidity.
Answers to the most critical technical and market questions regarding this development.

Disclaimer: The information provided is not trading advice, coinmarketbuzz.com holds no liability for any investments made based on the information provided on this page. We strongly recommend independent research and/or consultation with a qualified professional before making any investment decisions.
coinmarketbuzz.com leverages advanced AI technology to analyze market data. All content is fact-checked and reviewed by our editorial team to ensure accuracy and neutrality.