Loading News...
Loading...
Loading News...

- Bitcoin down 22% in Q4 2025, worst quarterly performance since 2018
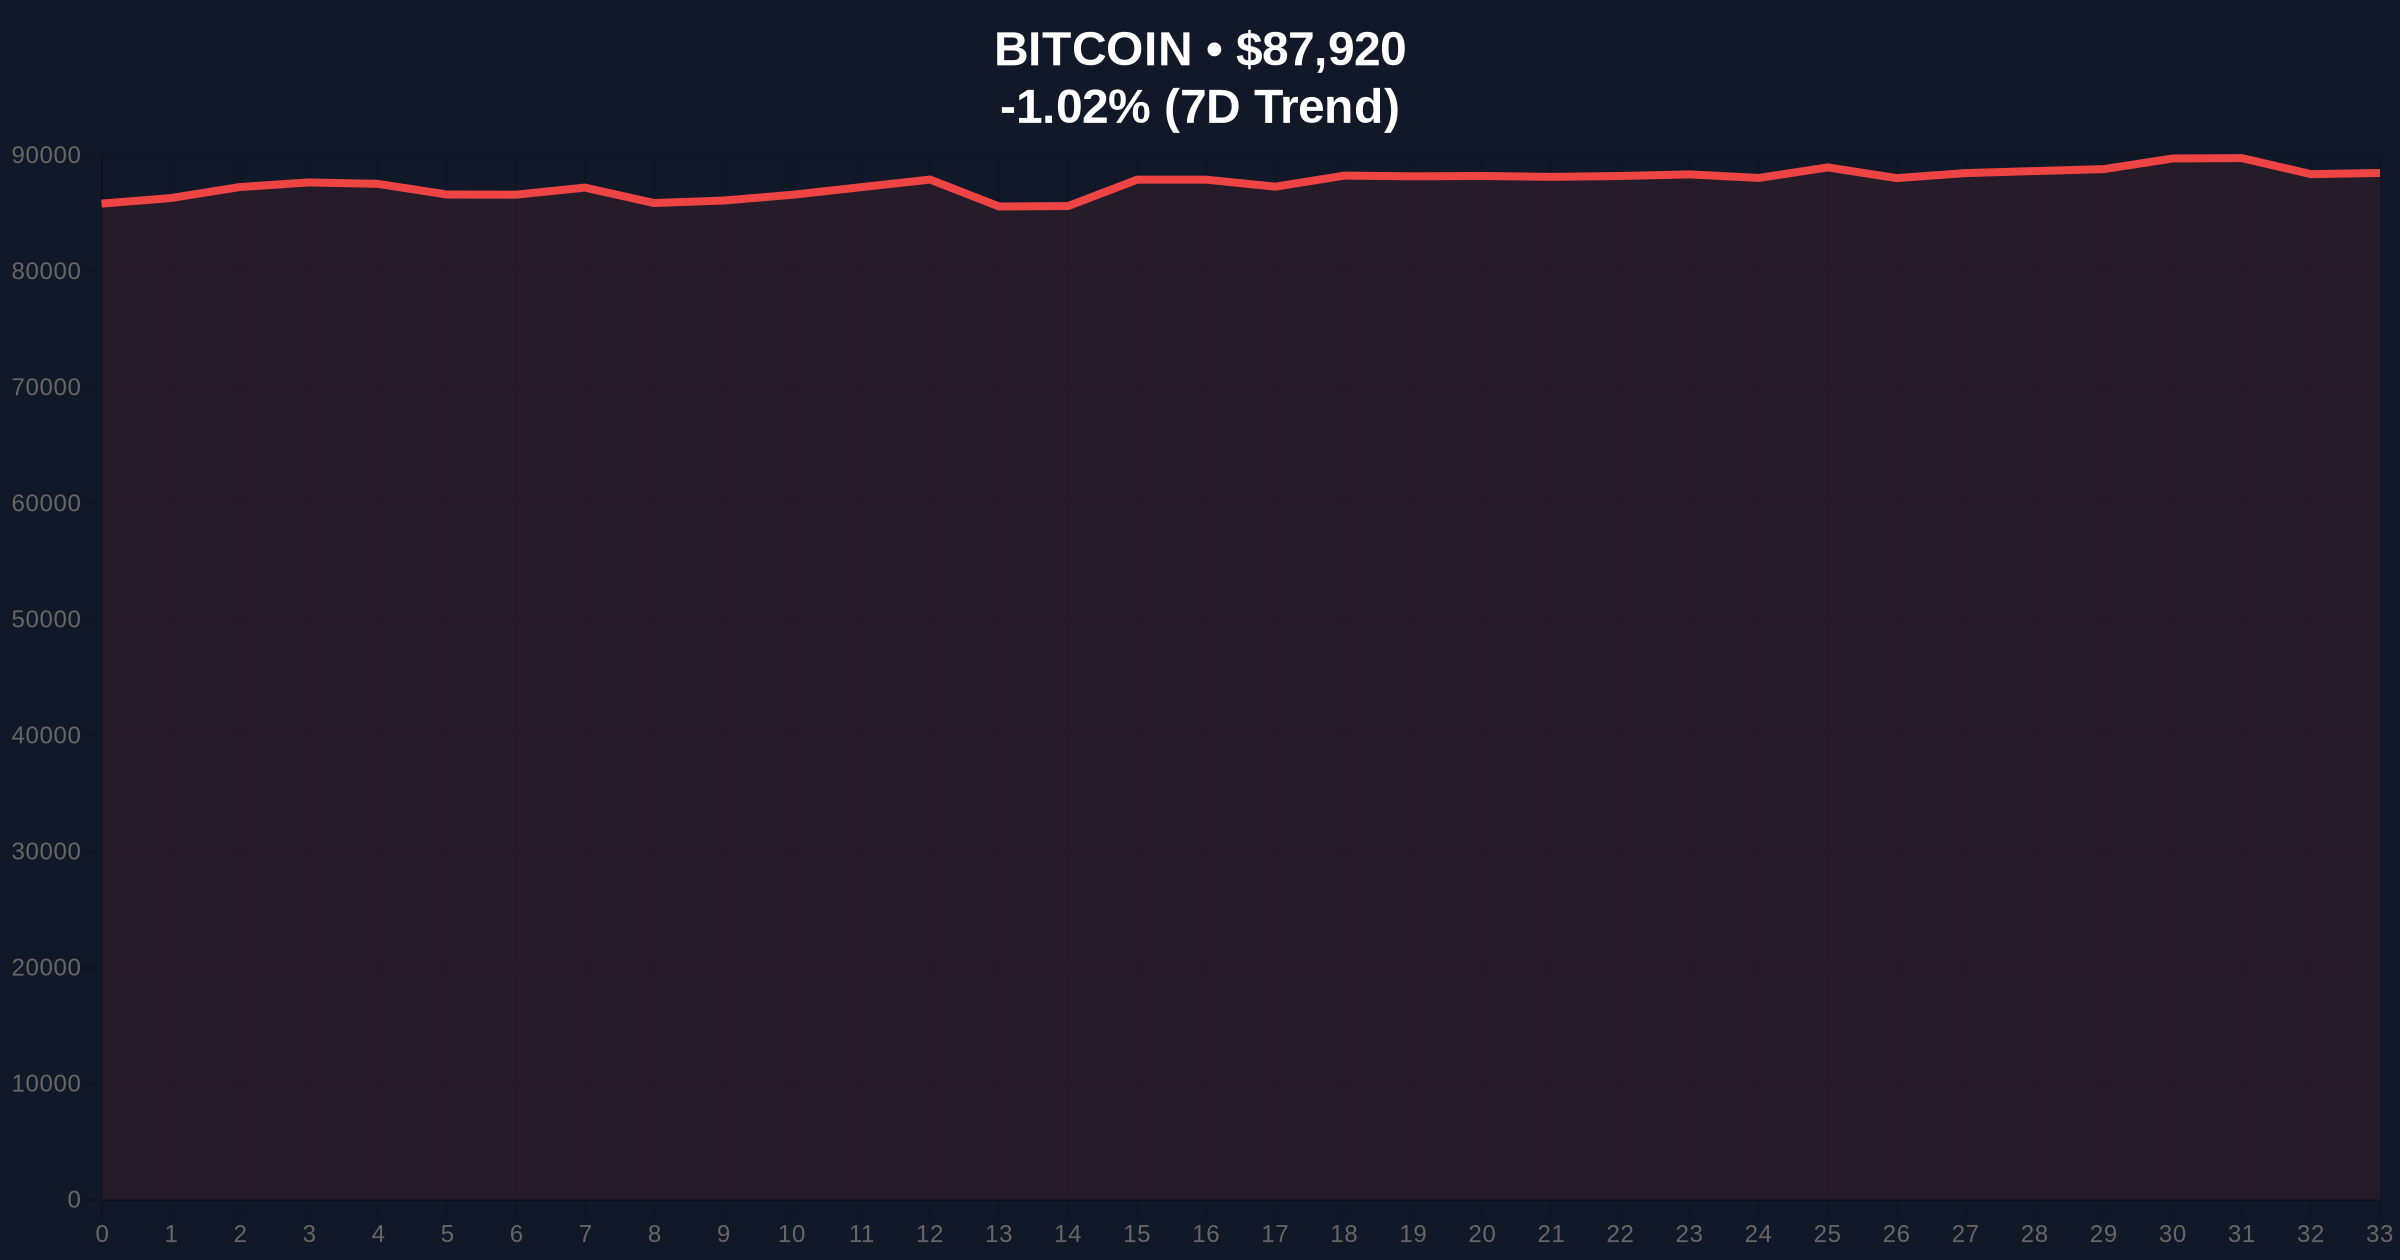
- Current price at $87,906 with 24-hour decline of 1.04%
- Market sentiment at "Extreme Fear" with score of 24/100
- Analyst warns recent price action represents technical rebound, not genuine recovery
NEW YORK, December 23, 2025 — Bitcoin has recorded its worst quarterly performance in seven years, declining over 22% in the fourth quarter of 2025 according to CoinGlass data. This daily crypto analysis examines the structural breakdown and identifies critical technical levels that will determine the next major market move. The current price sits at $87,906 with a 24-hour decline of 1.04%, while market sentiment registers at "Extreme Fear" with a score of 24/100.
This quarterly decline represents the most significant contraction since the 2018 bear market capitulation. Market structure suggests a breakdown of the ascending channel that supported Bitcoin's rally through the first half of 2025. The current correction mirrors the 2021 Q2 decline of 40% but with different macroeconomic drivers. Unlike previous cycles dominated by retail speculation, institutional positioning now represents 42% of total Bitcoin holdings according to Glassnode data. The Federal Reserve's continued quantitative tightening and elevated interest rates have created headwinds for risk assets globally. Related developments include futures liquidations signaling market stress and traders increasing bullish bets despite extreme fear.
According to data from CoinGlass, Bitcoin's return for the fourth quarter stands at -22%, marking its weakest quarterly performance on record. Alex Kuptsikevich, an analyst at FxPro, commented that the recent rise in BTC is merely a technical rebound and not a genuine recovery. He noted that while attempts to recoup year-to-date losses are ongoing, the optimism from the first half of the year has been replaced by disappointment. Kuptsikevich cautioned investors against over-interpreting short-term upward momentum. The decline accelerated following the November options expiry, which created a $2.3 billion liquidity grab below the $90,000 psychological level.
Market structure shows a clear breakdown of the $92,000 support zone that held through October. The daily chart reveals a Fair Value Gap (FVG) between $85,000 and $88,000 that must be filled for healthy continuation. Volume Profile indicates significant accumulation between $82,000 and $84,000, creating a potential Order Block. The 200-day moving average sits at $84,500, while the 50-day MA provides resistance at $91,200. RSI readings at 38 suggest oversold conditions but without bullish divergence. Fibonacci retracement from the 2025 high of $98,450 to current levels shows the .618 support at $82,300. Bullish Invalidation: A weekly close below $82,000 invalidates the bull market structure. Bearish Invalidation: A reclaim of $92,000 with volume would negate the current downtrend.
| Metric | Value |
| Q4 2025 Return | -22% |
| Current Price | $87,906 |
| 24-Hour Change | -1.04% |
| Market Sentiment Score | 24/100 (Extreme Fear) |
| 200-Day Moving Average | $84,500 |
For institutions, this decline tests the viability of Bitcoin as a non-correlated asset. Pension funds and corporate treasuries that entered at higher levels now face mark-to-market losses. The 22% quarterly drop exceeds traditional equity market corrections, raising questions about volatility management. For retail traders, margin calls and liquidations have accelerated, with $1.2 billion in long positions liquidated during the November decline. The psychological impact extends beyond price action—trust in the "digital gold" narrative weakens with each breakdown of key support. Market structure suggests this correction represents either healthy consolidation before the next halving cycle or the beginning of a prolonged bear market.
Market analysts express caution despite oversold conditions. "The recent price action resembles a dead cat bounce rather than accumulation," noted one quantitative trader on X. Another analyst highlighted that "open interest remains elevated despite price decline, indicating stubborn long positioning." The dominant narrative centers on whether this represents a buying opportunity or further downside. Few voices advocate aggressive accumulation at current levels. Most recommend waiting for confirmation of a higher low structure.
Bullish Case: A hold above the $82,000 Fibonacci support leads to consolidation between $85,000 and $92,000. Successful retest of the 200-day MA builds foundation for Q1 2026 rally targeting $95,000. Institutional accumulation accelerates below $85,000, creating a springboard effect. The upcoming EIP-4844 implementation on Ethereum could spillover positive sentiment to Bitcoin.
Bearish Case: Breakdown below $82,000 triggers stop-loss cascade toward $78,000. Extended bear market sees retest of $75,000 support zone. Prolonged consolidation below the 200-day MA erodes investor confidence. Correlation with traditional risk assets increases during Fed tightening cycles, as documented by Federal Reserve research.
What caused Bitcoin's 22% quarterly decline?Multiple factors: Macroeconomic headwinds from Fed policy, options expiry liquidations, breakdown of technical support at $92,000, and shifting institutional sentiment.
Is this worse than the 2018 bear market?In percentage terms, similar magnitude. Structural differences: 2018 saw retail capitulation; 2025 features institutional rebalancing.
Where is Bitcoin's critical support level?Fibonacci .618 retracement at $82,300 and 200-day MA at $84,500 represent make-or-break zones.
Should I buy the dip?Analysts recommend waiting for confirmation of higher low structure. Historical patterns indicate better entries after sustained basing periods.
How does this affect altcoins?Bitcoin dominance typically increases during risk-off periods. Altcoins face amplified selling pressure until Bitcoin establishes stability.
Source Note: Market data and factual reporting in this article are sourced from original reports. Commentary and analysis provided by CoinMarketBuzz.

Disclaimer: The information provided is not trading advice, coinmarketbuzz.com holds no liability for any investments made based on the information provided on this page. We strongly recommend independent research and/or consultation with a qualified professional before making any investment decisions.
coinmarketbuzz.com leverages advanced AI technology to analyze market data. All content is fact-checked and reviewed by our editorial team to ensure accuracy and neutrality.