Loading News...
Loading...
Loading News...

- Bitcoin buying pressure shows clear slowdown across market and on-chain metrics
- Pattern resembles late-stage bull market distribution phases from 2021 cycle
- Active addresses plummet, indicating weakening market participation and vitality
- Global crypto sentiment registers "Extreme Fear" with score of 24/100
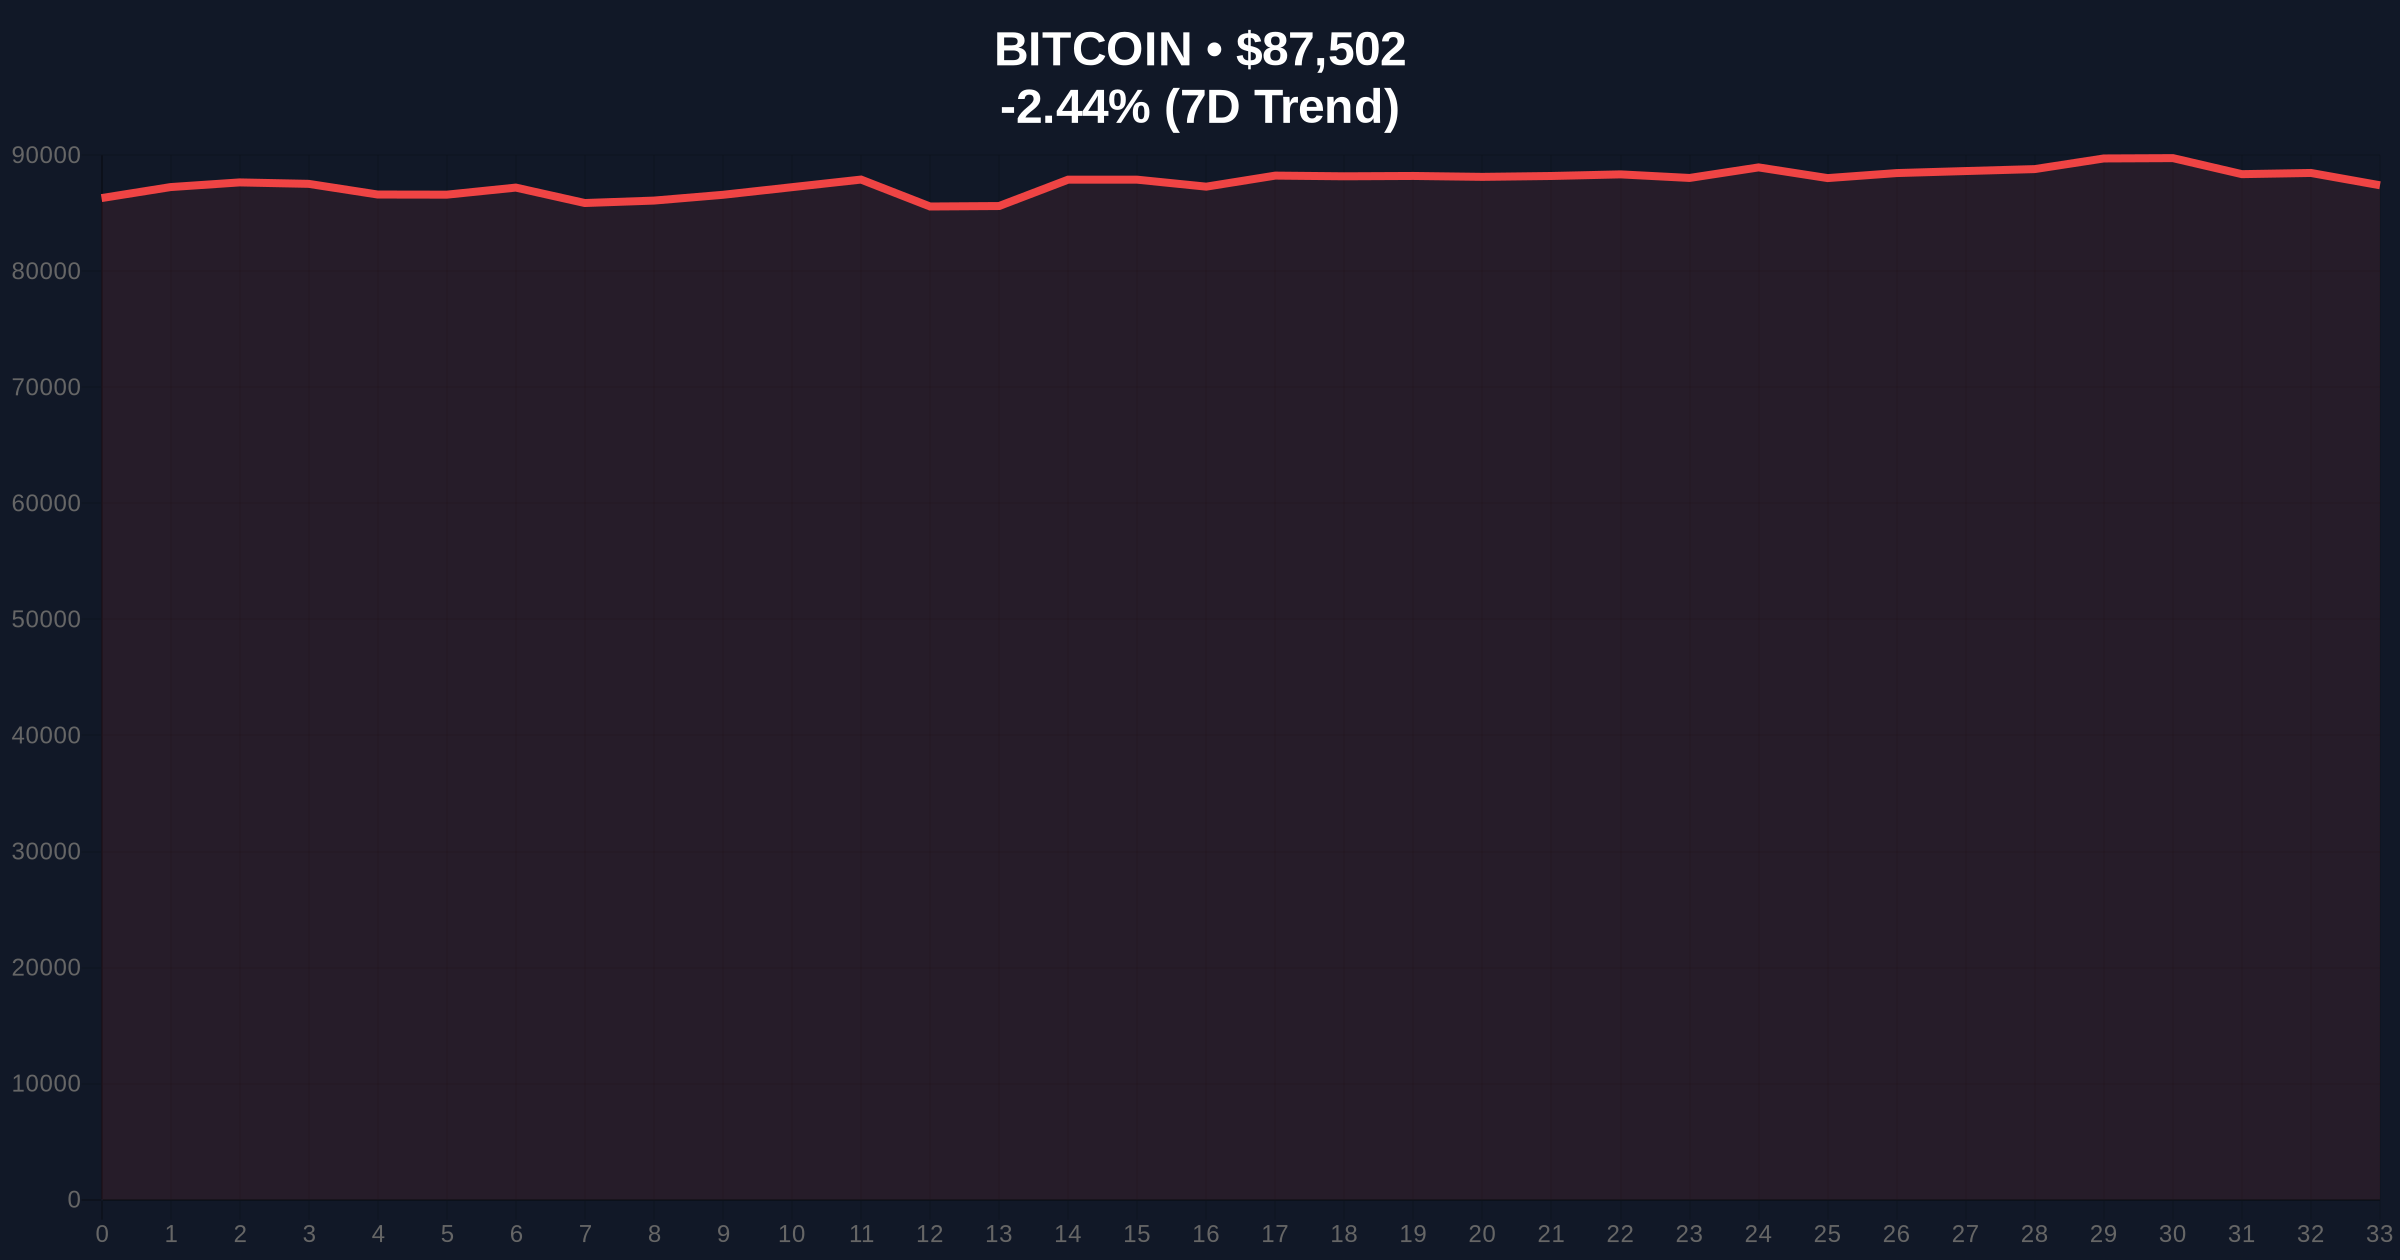
NEW YORK, December 23, 2025 — Daily crypto analysis reveals Bitcoin's buying pressure has entered a pronounced slowdown across both market and on-chain data, with patterns mirroring late-stage bull run distributions from previous cycles. According to analyst Mignolet, this divergence between price action and volume metrics suggests the market may have already passed its peak, with current conditions resembling the final distribution phase of the 2021 bull market. The analysis comes as Bitcoin trades at $87,491, down 2.45% over 24 hours, while global crypto sentiment registers "Extreme Fear" at 24/100.
Market structure suggests Bitcoin's current behavior aligns with historical late-cycle patterns where price appreciation decouples from underlying buying pressure. This phenomenon typically precedes significant corrections as smart money distributes holdings to retail participants. The 2021 cycle demonstrated similar characteristics when Bitcoin reached its all-time high near $69,000 while on-chain metrics showed deteriorating fundamentals. Underlying this trend is the psychological transition from accumulation to distribution phases, where institutional players reduce exposure while retail interest remains elevated. Consequently, the current divergence between futures prices and buying volume represents a classic warning signal that has preceded previous market reversals.
Related developments in the current market environment include Bitcoin futures ratios approaching parity amid extreme fear sentiment and exchange rebranding activities during similar market conditions.
According to on-chain data analyzed by crypto analyst Mignolet, Bitcoin has experienced a clear slowdown in buying pressure across multiple metrics since August 2025. The analyst identified a critical divergence in the Binance futures market where prices continued rising while buying volume consistently decreased. This pattern mirrors the 2021 market cycle and shows no signs of improvement according to the analysis. Concurrently, the number of active Bitcoin addresses has plummeted, with Mignolet explaining this metric links directly to on-chain over-the-counter activity. The data suggests a general weakening of market participation and vitality, indicating what the analyst describes as a final distribution phase similar to the end of the 2021 bull run. While a significant reversal was expected at some point, the market appears to be experiencing distribution rather than correction, implying the peak may have already occurred.
Market structure indicates Bitcoin faces critical technical levels as buying pressure diminishes. The current price of $87,491 sits below the psychological $90,000 resistance level, with the 24-hour decline of 2.45% reflecting weakening momentum. Volume profile analysis shows decreasing participation on upward moves, creating potential Fair Value Gaps (FVGs) that may attract liquidity grabs. The 50-day moving average at approximately $85,200 provides immediate support, while Fibonacci retracement levels from the recent swing high suggest potential support at $82,000 (61.8% level). Relative Strength Index (RSI) readings hover near neutral territory but show bearish divergence on higher timeframes. Order blocks from previous accumulation zones between $78,000-$80,000 represent critical support clusters that must hold to maintain bullish structure.
Bullish invalidation occurs if Bitcoin breaks and closes below the $78,000 support level, which would confirm distribution phase completion. Bearish invalidation requires reclaiming and sustaining above $92,000 with accompanying volume expansion, negating the current divergence pattern.
| Metric | Value |
| Bitcoin Current Price | $87,491 |
| 24-Hour Price Change | -2.45% |
| Global Crypto Sentiment Score | 24/100 (Extreme Fear) |
| Market Rank | #1 |
| Key Support Level (50-day MA) | $85,200 |
This development matters significantly for both institutional and retail market participants. For institutions, the divergence between price and volume represents a classic risk management signal, potentially triggering systematic rebalancing or hedging activities. The pattern similarity to 2021 suggests quantitative models may flag increased correlation risk across crypto portfolios. For retail traders, the plummeting active addresses metric indicates reduced network vitality, potentially affecting transaction efficiency and increasing volatility during low-liquidity periods. The broader implication involves the potential breakdown of the traditional four-year cycle hypothesis, which has guided investment timing for numerous market participants. If the current distribution phase completes without the expected sharp correction, it may indicate structural market changes requiring adjusted analytical frameworks.
Market analysts express concern about the sustainability of current price levels given the deteriorating fundamentals. According to sentiment aggregated from professional trading communities, the prevailing view suggests caution until volume confirms price direction. Some quantitative analysts point to parallels with traditional market tops where price continues climbing while underlying participation declines. The extreme fear sentiment reading of 24/100 reflects this cautious outlook, with many traders awaiting clearer signals before committing additional capital. This collective hesitation itself contributes to the volume decline, creating a self-reinforcing cycle that typically resolves through significant price movement.
Bullish Case: If Bitcoin holds above the $85,200 support and experiences a volume surge, it could invalidate the current divergence pattern. A reclaim of $92,000 with expanding volume would suggest the distribution phase has concluded and accumulation has resumed. This scenario would likely involve institutional capital re-entering through over-the-counter desks, reflected in recovering active address metrics. Historical patterns indicate such moves often precede accelerated rallies as trapped bears cover positions.
Bearish Case: Continued volume decline beneath current price levels increases probability of a liquidity grab toward the $82,000 Fibonacci support. A breakdown below $78,000 would confirm distribution completion and potentially trigger accelerated selling as stop-loss orders cluster beneath key technical levels. This scenario mirrors the 2021 cycle where similar divergences preceded corrections exceeding 50% from peak values. The extreme fear sentiment could amplify downward momentum if retail participants panic-sell during breakdowns.
What does slowing Bitcoin buying pressure indicate? Slowing buying pressure typically indicates reduced institutional accumulation and potential distribution to retail participants, often preceding market corrections.
How does the current pattern compare to 2021? The current divergence between price and volume mirrors late-2021 patterns where Bitcoin reached all-time highs while on-chain metrics deteriorated, preceding a significant correction.
What is the significance of active addresses declining? Active address decline suggests reduced network participation and over-the-counter activity, indicating weakening fundamental support for current price levels.
How reliable are these indicators for predicting market turns? While no indicator provides certainty, volume-price divergences have historically shown strong correlation with major market inflection points when confirmed across multiple timeframes.
What should traders monitor in coming weeks? Traders should monitor volume patterns around key support levels, particularly whether buying volume expands on upward moves or continues declining, which would confirm distribution phase continuation.
Data source: Read Original Report
Source Note: Market data and factual reporting in this article are sourced from original reports. Commentary and analysis provided by CoinMarketBuzz.

Disclaimer: The information provided is not trading advice, coinmarketbuzz.com holds no liability for any investments made based on the information provided on this page. We strongly recommend independent research and/or consultation with a qualified professional before making any investment decisions.
coinmarketbuzz.com leverages advanced AI technology to analyze market data. All content is fact-checked and reviewed by our editorial team to ensure accuracy and neutrality.