Loading News...
Loading...
Loading News...

- Short-term Bitcoin holders enter loss-making zone with price below $87,500
- $90,300 resistance represents break-even point where selling pressure could intensify
- Market structure requires consolidation above $90,000 for trend reversal confirmation
- Global crypto sentiment registers "Extreme Fear" at 24/100 score
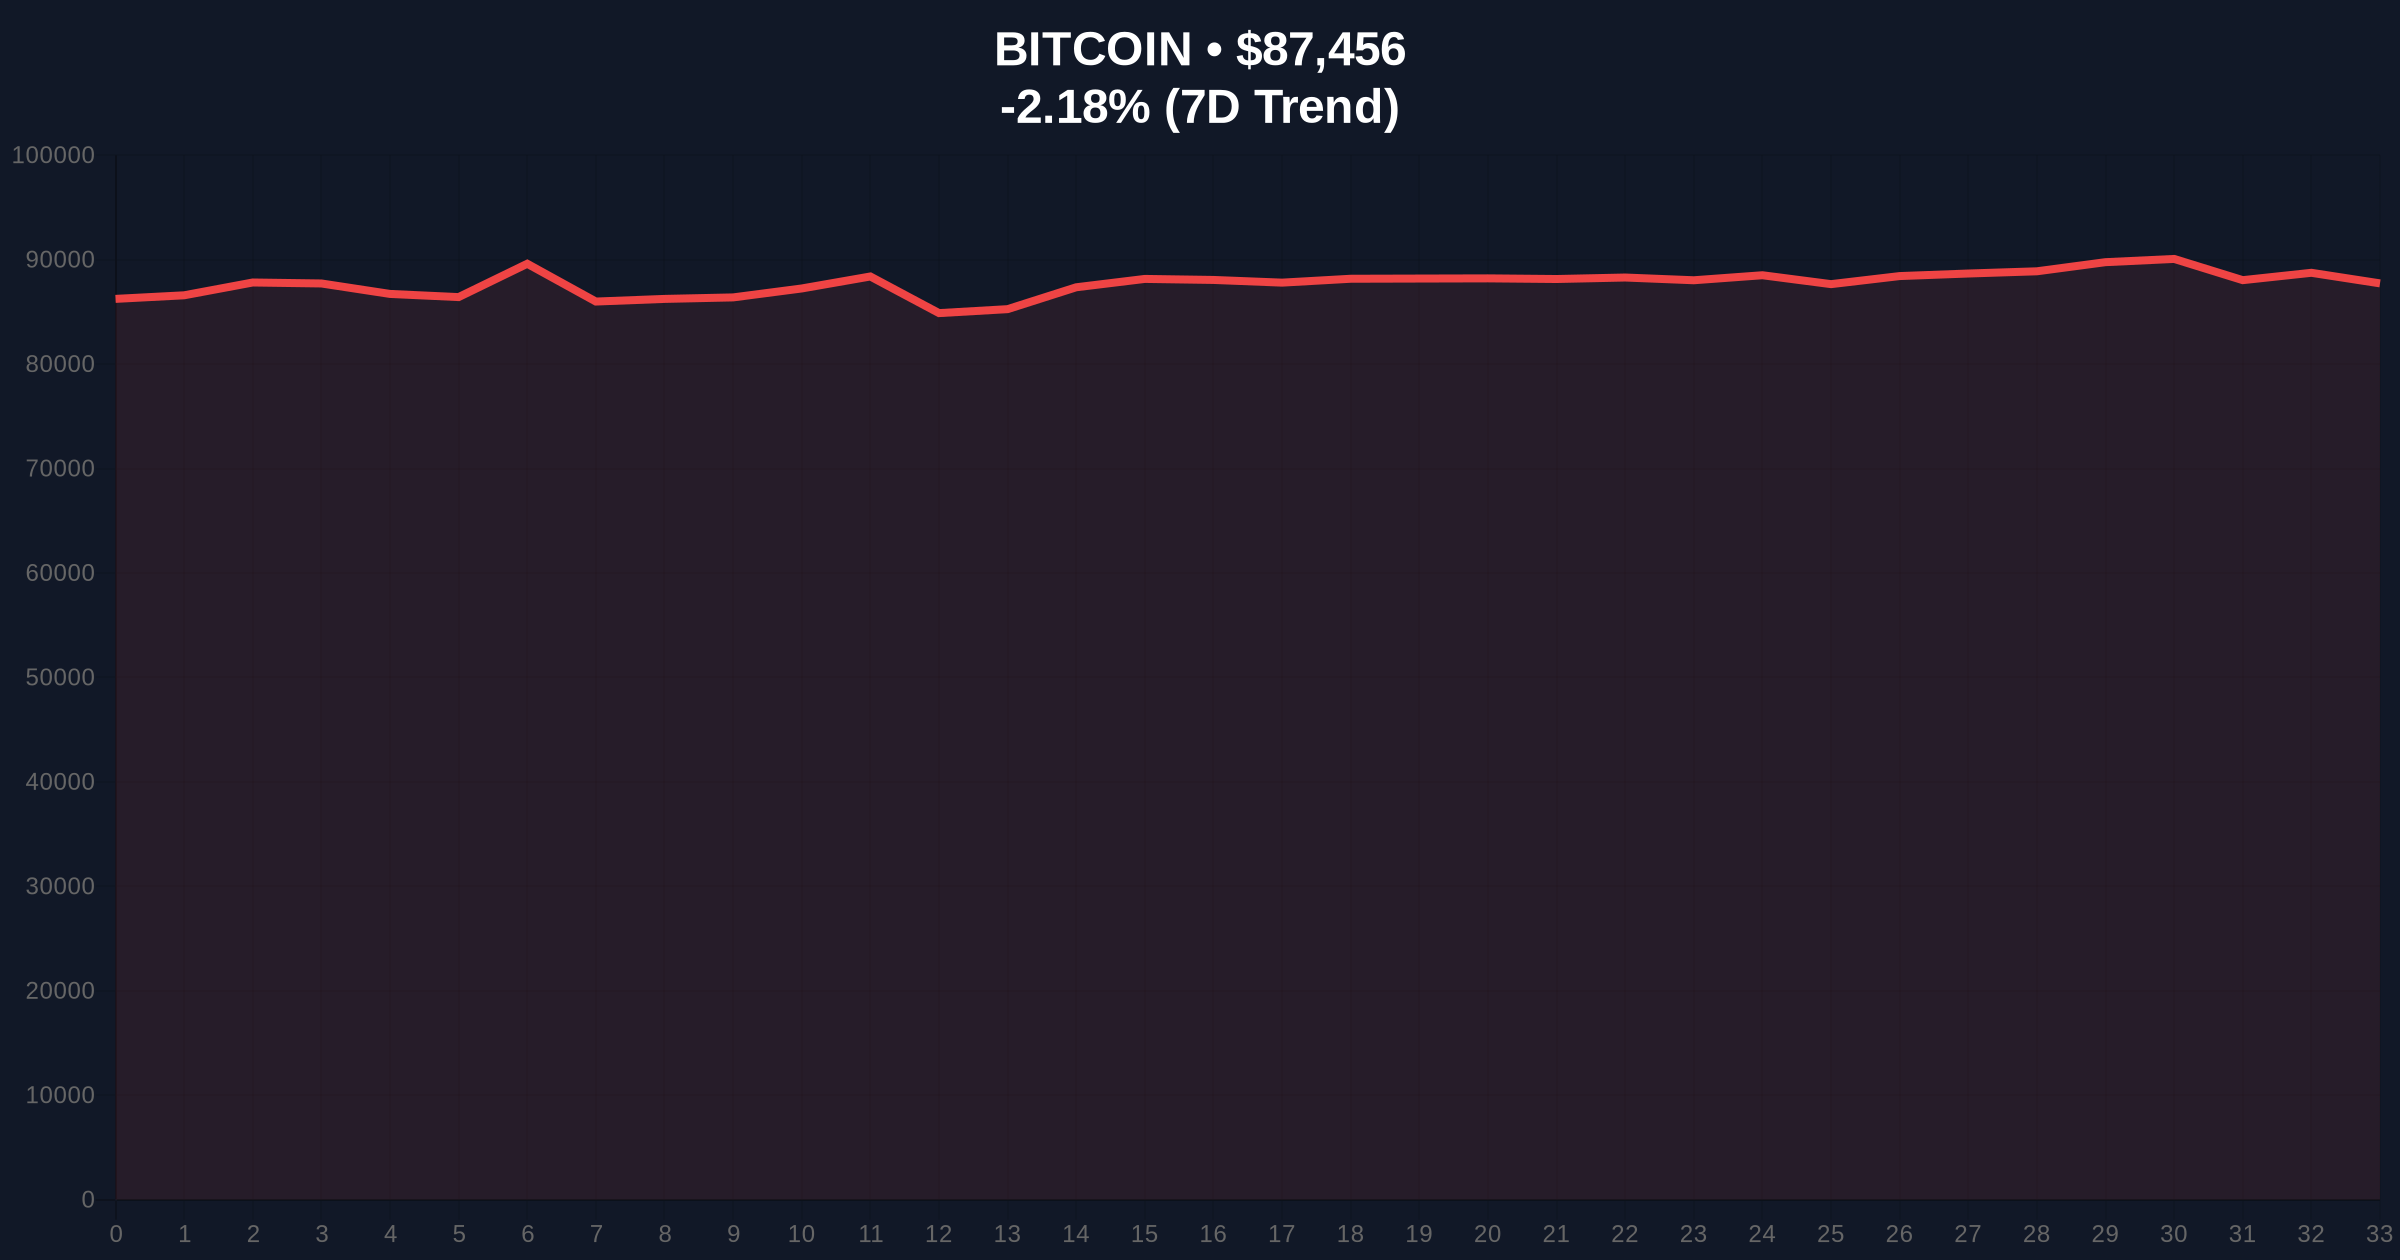
NEW YORK, December 23, 2025 — Bitcoin's price action has pushed short-term holders into a loss-making position, with the $90,000 level emerging as a critical resistance zone that must be reclaimed for any meaningful recovery, according to the latest daily crypto analysis. Market structure suggests that with BTC trading at $87,495, below the average cost basis for recent buyers, the nearest significant resistance at $90,300 represents a potential liquidity grab zone where selling pressure could intensify as holders attempt to break even.
This current price action mirrors patterns observed during the 2021 correction, when Bitcoin experienced similar compression below short-term holder cost basis. Historical data from Glassnode indicates that when the price trades below the realized price of short-term holders (those holding for less than 155 days), it typically creates a Fair Value Gap (FVG) that must be filled before sustainable upward momentum can resume. The current market structure resembles the July 2021 consolidation phase, where Bitcoin traded between $29,000 and $35,000 for approximately 60 days before breaking out. Similar to that period, the current market is experiencing what quantitative analysts refer to as a "liquidity vacuum" below key psychological levels.
Related developments in the broader cryptocurrency ecosystem include regulatory pressures affecting exchange operations, as seen in Bybit's recent exit from the Japanese market, and ongoing discussions about tokenization initiatives that could impact long-term liquidity dynamics, such as Japan's proposed tokenized bond framework.
According to on-chain data analyzed by cryptocurrency analyst Axel Adler Jr., Bitcoin's decline to $87,400 has placed the asset below the average acquisition cost for short-term holders. This creates what technical analysts term an "order block" of underwater positions between approximately $87,000 and $90,300. Adler's analysis indicates that the $90,300 level represents the nearest significant resistance, corresponding to the break-even point for many recent buyers. Market structure suggests that even if price rebounds toward this level, selling pressure could intensify as holders attempt to exit at cost basis rather than at a loss. The analyst concluded that an initial sign of trend reversal would require price consolidation above $90,000, which must precede any sustained bullish momentum.
Volume profile analysis indicates significant trading activity between $85,000 and $90,000, creating what technical analysts refer to as a "high-volume node" that typically acts as strong support or resistance. The 50-day moving average at approximately $89,200 provides additional resistance overhead, while the 200-day moving average at $82,500 represents longer-term support. Relative Strength Index (RSI) readings at 42 suggest neutral momentum with slight bearish bias. Market structure suggests that a break above the Fibonacci 0.618 retracement level at $91,500 would invalidate the current bearish structure and potentially trigger what options traders refer to as a "gamma squeeze" in the derivatives market.
Bullish invalidation level: $82,000 (below 200-day MA and key Fibonacci support). Bearish invalidation level: $92,000 (above current resistance cluster and psychological round number).
| Metric | Value |
| Current Bitcoin Price | $87,495 |
| 24-Hour Price Change | -2.14% |
| Critical Resistance Level | $90,300 |
| Global Crypto Sentiment Score | 24/100 (Extreme Fear) |
| Market Rank | #1 |
For institutional investors, the short-term holder cost basis represents a key psychological level where automated trading systems often place stop-loss orders and liquidation triggers. The concentration of underwater positions creates what market makers refer to as a "liquidity grab" opportunity around the $90,000 level. Retail impact manifests differently: smaller holders facing losses may exhibit what behavioral economists term "loss aversion bias," holding positions longer than rational analysis would suggest in hopes of breaking even. This dynamic creates what technical analysts identify as "supply overhang" that must be absorbed before sustainable upward movement can occur. The Federal Reserve's monetary policy decisions, particularly regarding the Fed Funds Rate, continue to influence macro liquidity conditions affecting all risk assets, including cryptocurrencies.
Market analysts on social platforms express cautious optimism tempered by recognition of technical hurdles. One quantitative trader noted, "The volume profile between $87K and $90K suggests we're in a distribution phase that needs resolution." Another analyst pointed to parallels with previous cycles: "Similar to the 2019 accumulation pattern, we need time above the short-term holder cost basis to reset market psychology." The prevailing sentiment among professional traders emphasizes patience and discipline rather than reactionary positioning.
Bullish Case: If Bitcoin consolidates above $90,000 for 7-10 trading sessions, market structure suggests a retest of the all-time high near $100,000 becomes probable. This scenario requires sustained buying pressure to absorb the supply overhang from underwater short-term holders. Historical patterns indicate that once the short-term holder realized price is reclaimed, momentum typically accelerates as fear transforms to greed.
Bearish Case: Failure to reclaim $90,000 within the current trading window suggests continued downward pressure toward the $82,000 support level. This would represent approximately a 6% decline from current levels and would likely trigger additional liquidations in the derivatives market. Market structure indicates that a break below $82,000 would invalidate the current consolidation thesis and suggest deeper correction toward $75,000.
What does "short-term holders at a loss" mean?This refers to Bitcoin addresses that acquired coins within approximately the last 155 days whose current market value is below their purchase price.
Why is $90,000 so important for Bitcoin?The $90,000 level represents the average cost basis for recent buyers, making it a psychological break-even point where selling pressure often intensifies.
What is the Fear & Greed Index showing?The current reading of 24 indicates "Extreme Fear," suggesting negative market sentiment that historically precedes potential buying opportunities.
How does this compare to previous Bitcoin cycles?Similar patterns occurred in 2021 and 2019 when Bitcoin traded below short-term holder cost basis before eventual breakouts.
What technical indicators should traders watch?Key levels include the $90,300 resistance, $82,000 support, 50-day and 200-day moving averages, and RSI divergence patterns.
Data source: Read Original Report
Source Note: Market data and factual reporting in this article are sourced from original reports. Commentary and analysis provided by CoinMarketBuzz.

Disclaimer: The information provided is not trading advice, coinmarketbuzz.com holds no liability for any investments made based on the information provided on this page. We strongly recommend independent research and/or consultation with a qualified professional before making any investment decisions.
coinmarketbuzz.com leverages advanced AI technology to analyze market data. All content is fact-checked and reviewed by our editorial team to ensure accuracy and neutrality.