Loading News...
Loading...
Loading News...

VADODARA, February 6, 2026 — Bitcoin has shed over $30,000 in value across two months, yet cryptocurrency fundamentals remain unchanged. This daily crypto analysis, citing data from the Kobeissi Letter, identifies October 10, 2025, as the structural inflection point. A single-day liquidation of $19 billion in leveraged positions triggered the decline. Market depth has since collapsed by over 30%, reaching levels not seen since the FTX implosion in 2022.
According to the Kobeissi Letter analysis, October 10, 2025, marked a critical market structure failure. The liquidation of $19 billion in leveraged Bitcoin positions on that day created a massive liquidity grab. This event fundamentally altered order flow dynamics. Following the crash, Bitcoin entered a two-month consolidation phase from mid-November to mid-January. The market remained highly unstable. Repeated bidirectional liquidation gaps appeared, preventing a clean trend establishment.
Since January 24, 2026, an additional $10 billion in leverage has been wiped out. This represents 55% of the forced liquidations from the October event. The Kobeissi Letter suggests large institutions may have sold off or faced forced liquidations during the initial crash. This aligns with on-chain data showing significant UTXO movements from older wallets to exchanges. Market structure suggests these events created a series of unfilled Fair Value Gaps (FVGs) that price is now retesting.
Historically, similar leveraged unwinds have preceded major market bottoms. The 2021 bull market correction saw a $2.5 billion liquidation event over a week, not a single day. In contrast, the October 2025 event was more concentrated and severe. This rapid deleveraging mirrors aspects of the March 2020 crash but on a larger nominal scale. Underlying this trend is a broader macro shift. Rising real yields and quantitative tightening have pressured risk assets globally.
Consequently, Bitcoin's correlation with traditional risk-off moments has increased. The current extreme fear sentiment, scoring 9/100, often precedes trend reversals. Similar readings were observed at the November 2022 market low following FTX's collapse. The analysis predicts a market bottom will form when price capitulation and leverage washout coincide with peak bearish sentiment. This point, it argues, may be approaching.
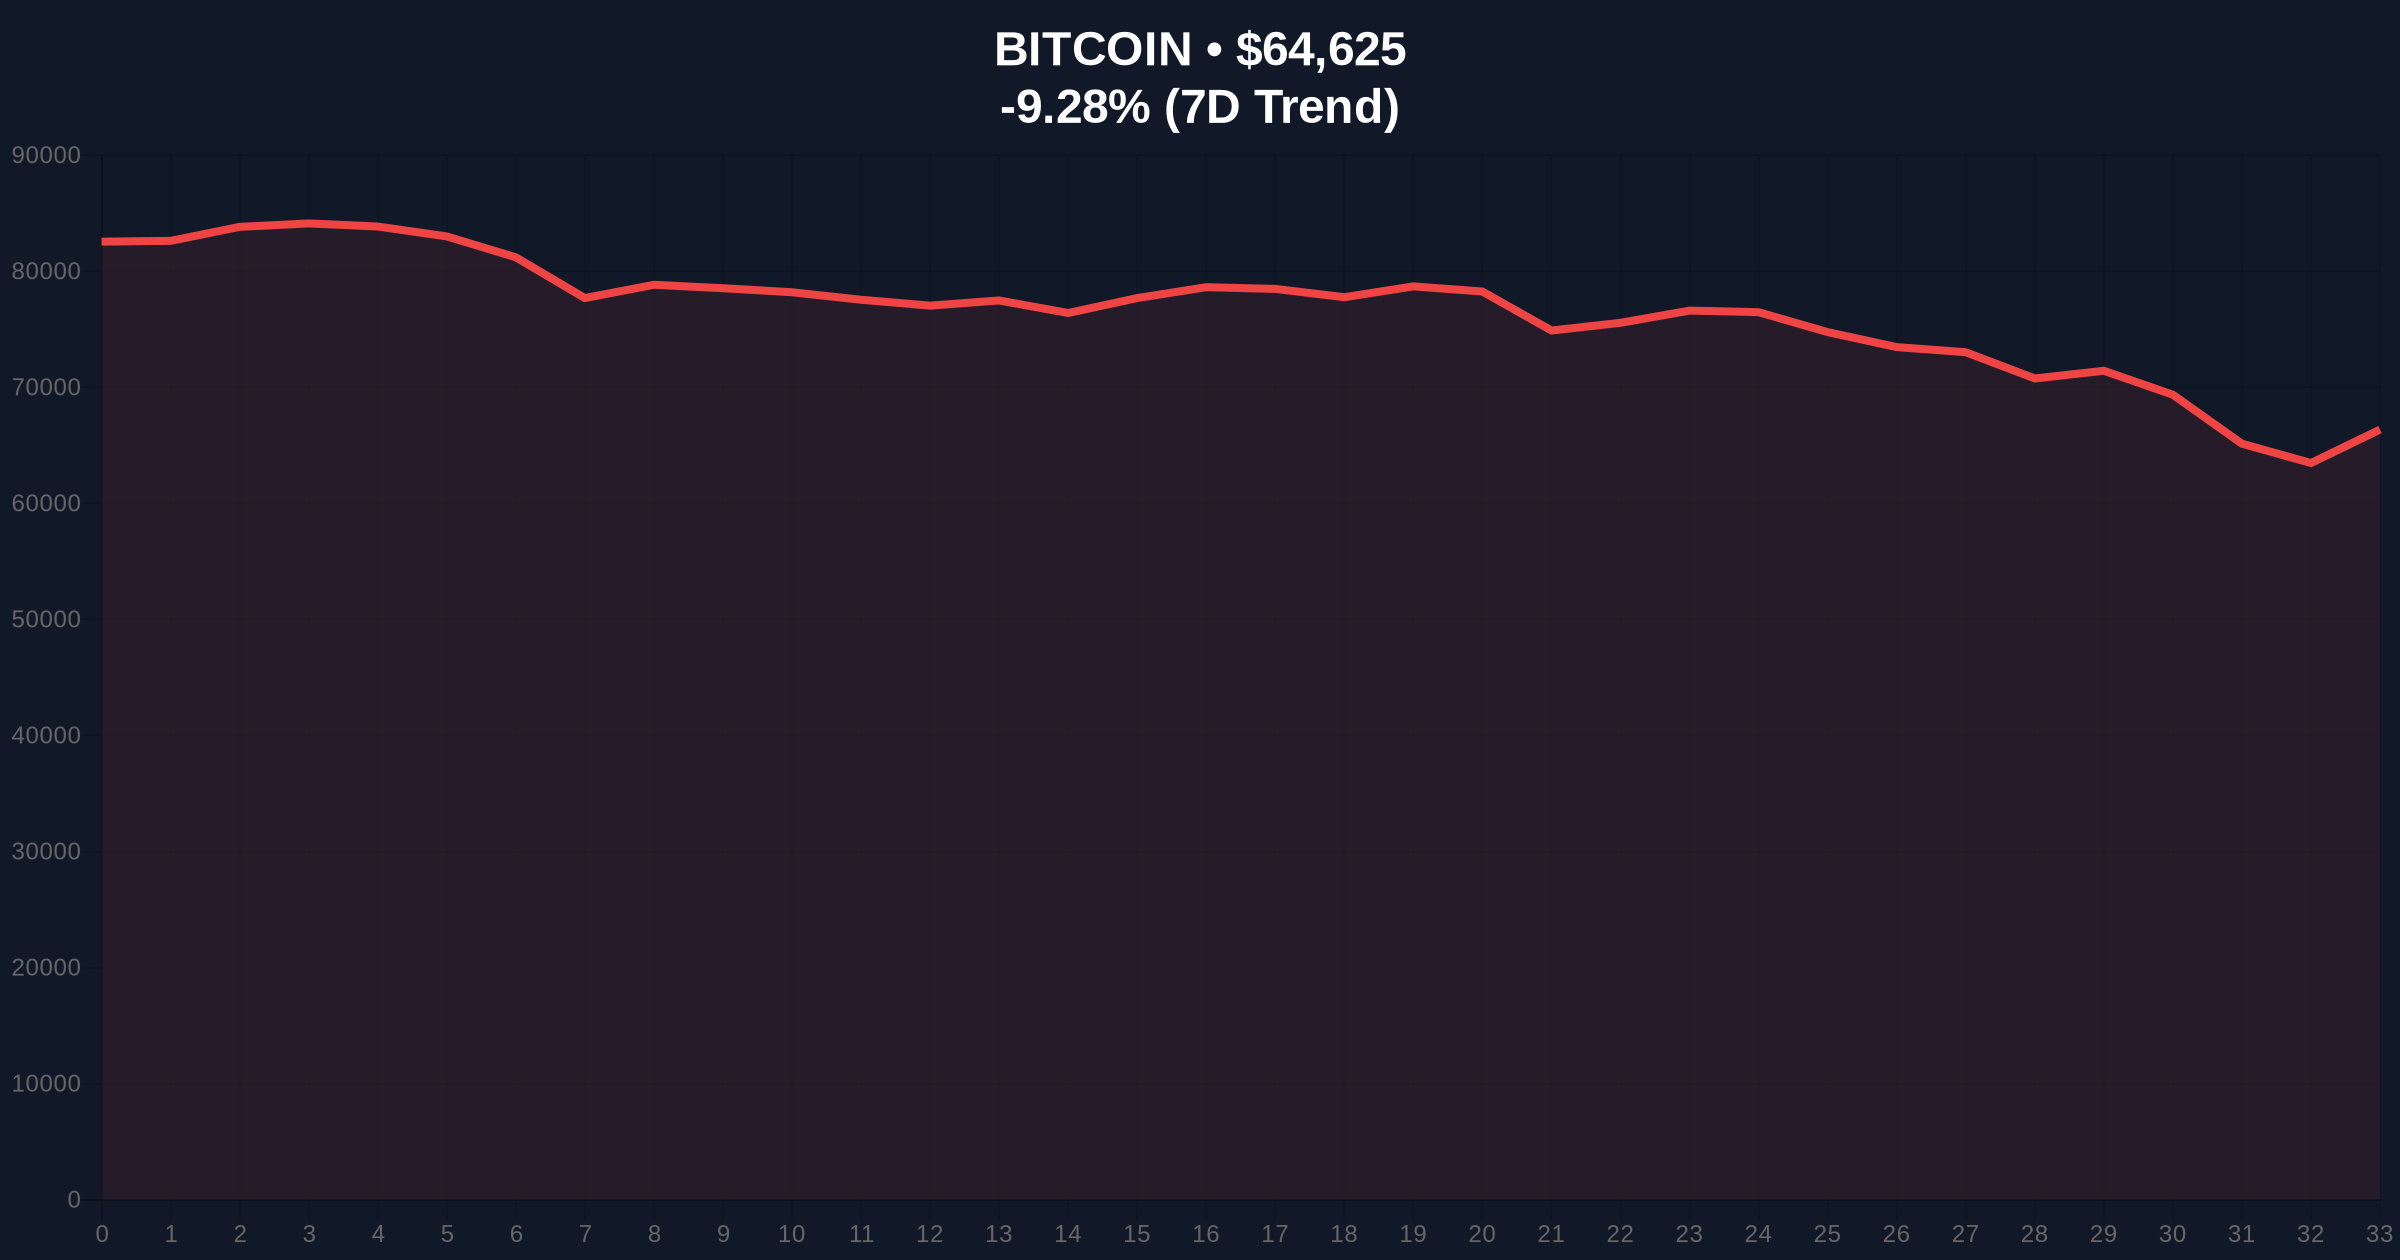
Current price action shows Bitcoin testing the $64,796 level. The 24-hour trend is -9.04%. Critical support now resides at the Fibonacci 0.618 retracement level of the 2023-2025 bull run, near $62,500. This level aligns with a high-volume node on the Volume Profile. A break below would invalidate the higher-timeframe bullish structure. Resistance is firmly established at the $72,000 order block created in late January.
The Relative Strength Index (RSI) on the weekly chart is approaching oversold territory, last seen in early 2023. However, momentum remains weak. The 200-day moving average, currently near $68,000, acts as dynamic resistance. Market depth, a measure of order book liquidity, has fallen over 30% from its October high. This thin liquidity exacerbates volatility and increases the likelihood of stop-loss cascades. For institutional context, refer to the Federal Reserve's current monetary policy stance on interest rates, which continues to pressure leverage.
| Metric | Value | Context |
|---|---|---|
| Crypto Fear & Greed Index | 9/100 (Extreme Fear) | Lowest since Nov 2022 |
| Bitcoin Current Price | $64,796 | Testing key support |
| 24-Hour Price Change | -9.04% | High volatility regime |
| October 10 Liquidation | $19 Billion | Single-day event |
| Market Depth Decline | >30% | Since Oct 2025 high |
This event matters because it represents a structural reset. The $19 billion liquidation erased a significant portion of speculative leverage. This has reduced market elasticity. Large orders now incur greater slippage. For long-term investors, this creates a more stable, albeit volatile, foundation. The purge of weak hands often precedes sustainable rallies. Retail sentiment is overwhelmingly negative, a classic contrarian indicator.
Institutional liquidity cycles suggest that after such a deleveraging, capital reallocation becomes more deliberate. The reduction in market depth indicates that major players have stepped back. This vacuum will eventually be filled, but timing is uncertain. The current environment tests the resilience of long-term holders. On-chain data shows HODLer net position change remains positive, suggesting conviction.
"The October liquidation was a liquidity black hole. It created a structural deficit that subsequent price action has failed to repair. We are now observing a compression in volatility and leverage that typically resolves in a powerful directional move. The key is identifying the invalidation level for the current bearish structure." — CoinMarketBuzz Intelligence Desk
Market structure suggests two primary scenarios. The first involves a hold of the $62,500 Fibonacci support, leading to a basing period and eventual rally. The second scenario sees a breakdown, targeting the next significant support zone near $58,000. This would likely trigger another wave of liquidations.
The 12-month institutional outlook remains cautiously optimistic. Historical cycles suggest that post-capitulation periods offer the highest risk-adjusted returns. The 5-year horizon is supported by continued adoption of Bitcoin as a treasury asset and the maturation of ETF products. However, near-term price discovery will be dictated by leverage reset and liquidity returning to the order books.

Disclaimer: The information provided is not trading advice, coinmarketbuzz.com holds no liability for any investments made based on the information provided on this page. We strongly recommend independent research and/or consultation with a qualified professional before making any investment decisions.
coinmarketbuzz.com leverages advanced AI technology to analyze market data. All content is fact-checked and reviewed by our editorial team to ensure accuracy and neutrality.