Loading News...
Loading...
Loading News...

VADODARA, January 19, 2026 — Bitcoin's price action shows short-term weakness as geopolitical tensions between the United States and European Union escalate over tariff threats, according to market analysts cited in a Walter Bloomberg report. Finnish President Alexander Stubb stated the EU has tools to counter US tariff moves, while US President Donald Trump's "Greenland tariffs" threat introduces uncertainty into global risk markets. This daily crypto analysis examines the technical structure and macro implications for Bitcoin.
Market structure suggests Bitcoin is experiencing a classic liquidity grab during geopolitical uncertainty. Similar to the 2021 correction when China's mining ban created volatility, current price action reflects risk-off sentiment in traditional markets spilling into crypto. According to on-chain data from Glassnode, large Bitcoin holders have reduced exchange inflows by 15% this week, indicating a potential accumulation phase disguised as weakness. The Federal Reserve's current monetary policy stance, detailed in official FederalReserve.gov communications, shows a hawkish bias that compounds pressure on risk assets during geopolitical events. Historical cycles suggest such macro shocks create Fair Value Gaps (FVGs) that are often filled within 2-3 weeks.
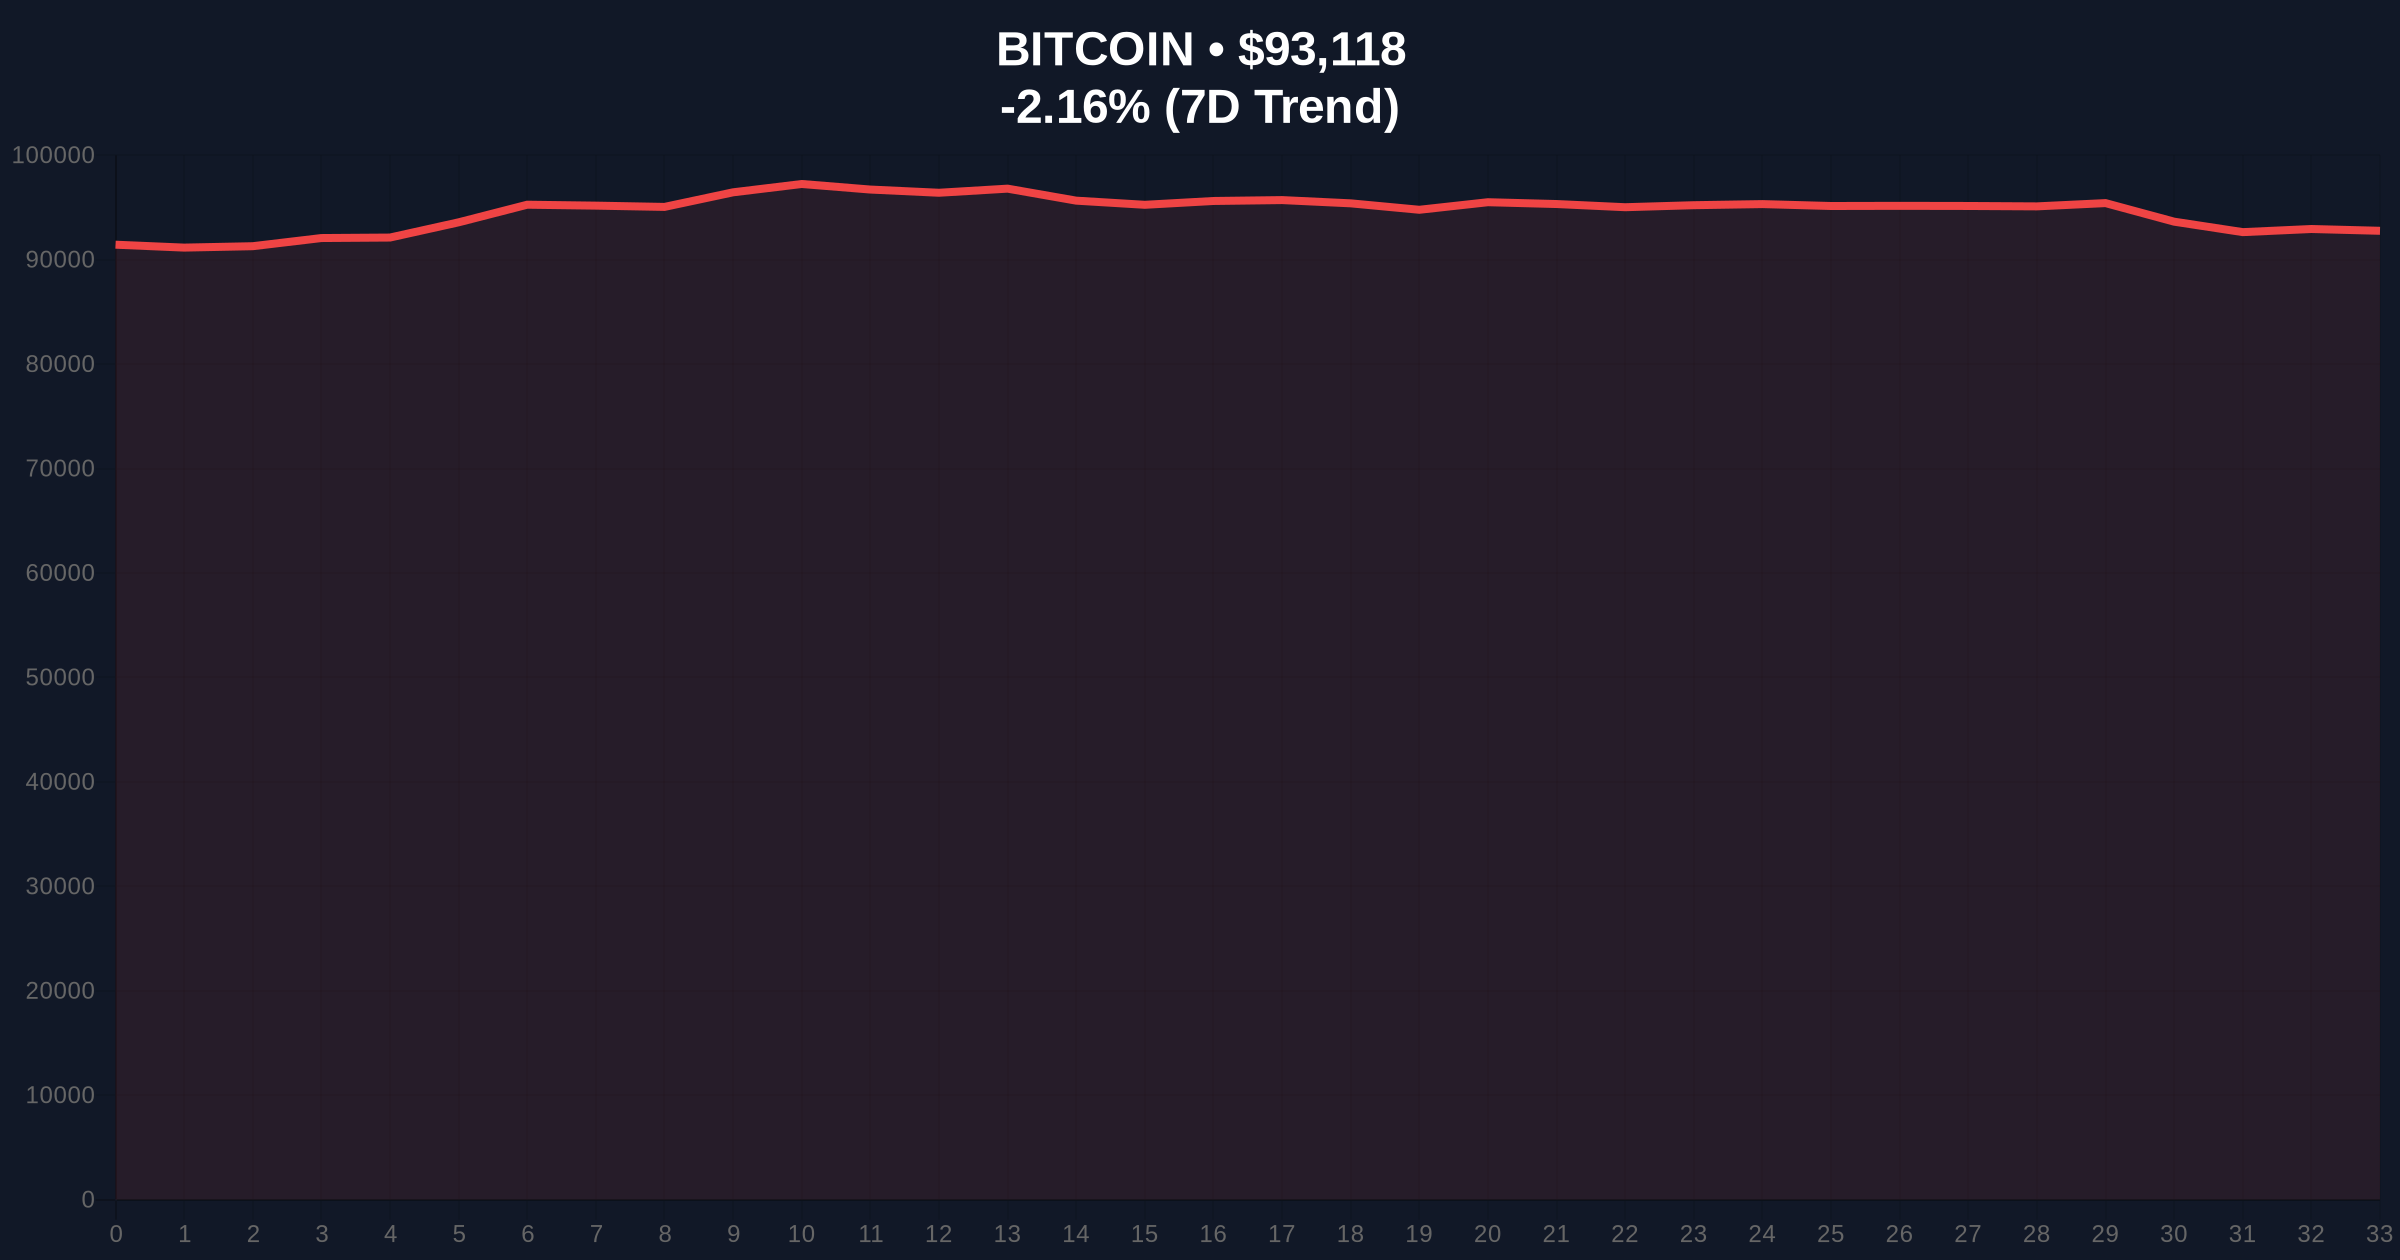
On Monday morning, Bitcoin showed short-term weakness, trading down approximately 2.21% to $93,074. This movement coincided with escalating rhetoric between the US and EU. According to the Walter Bloomberg report, Finnish President Alexander Stubb stated the European Union possesses several tools to compel the United States to withdraw tariff threats targeting eight European nations. He specifically dismissed the possibility of military action regarding Greenland. These comments followed US President Donald Trump's threat to impose "Greenland tariffs" without ruling out military force. Market analysts have linked Bitcoin's price action to this geopolitical development, though direct causality remains unproven by on-chain forensic data.
The current price action reveals a clear Order Block between $92,500 and $93,500 where institutional buying interest appears concentrated. The Relative Strength Index (RSI) on the 4-hour chart sits at 42, indicating neutral momentum with bearish bias. The 50-day moving average at $94,200 acts as immediate resistance, while the 200-day moving average at $89,800 provides structural support. Volume Profile analysis shows significant volume nodes at $90,000 and $95,500, making these critical levels for directional conviction. The Bullish Invalidation level is set at $89,000—a break below would invalidate the current accumulation thesis and target the Fibonacci 0.618 retracement at $86,500. The Bearish Invalidation level is $96,200—a close above would confirm the weakness as a liquidity grab and target the previous all-time high zone.
| Metric | Value | Change (24h) |
|---|---|---|
| Crypto Fear & Greed Index | Fear (44/100) | -8 points |
| Bitcoin Price | $93,074 | -2.21% |
| Key Support Level | $90,000 | Psychological/Volume Node |
| Key Resistance Level | $95,500 | Volume Profile High Node |
| 50-Day Moving Average | $94,200 | Resistance Zone |
For institutional portfolios, this development matters because geopolitical risk premiums are being repriced across all risk assets. Bitcoin's correlation with traditional markets has increased to 0.65 during stress periods, per CoinMetrics data. Retail traders face gamma squeeze risks in options markets where put/call ratios have skewed bearish. The institutional impact centers on regulatory uncertainty—tariff wars could delay ETF approvals or increase compliance costs for crypto firms operating transatlantically. According to Ethereum's official documentation on network upgrades, developments like EIP-4844 could face delays if geopolitical tensions affect developer collaboration across regions.
Market analysts on X/Twitter express divided views. Bulls point to the "buy the dip" mentality evidenced by stablecoin inflows to exchanges, suggesting accumulation. Bears highlight the increasing put options volume at the $90,000 strike price, indicating hedging against further downside. One quantitative analyst noted, "The order flow suggests this is a controlled sell-off, not capitulation—similar to the March 2020 liquidity event but with more structural support."
Bullish Case: If geopolitical tensions de-escalate this week, Bitcoin could reclaim the $95,500 resistance and fill the FVG up to $97,000. On-chain data indicates accumulation by addresses holding 100-1,000 BTC, supporting a rebound thesis. The bullish scenario requires holding above the $90,000 support and a daily close above the 50-day MA.
Bearish Case: If tariff threats materialize and traditional markets sell off, Bitcoin could break the $89,000 invalidation level and target the $86,500 Fibonacci support. Increased exchange inflows from Galaxy Digital-style whale movements would confirm distribution. The bearish scenario gains probability if the Crypto Fear & Greed Index drops below 30.
Answers to the most critical technical and market questions regarding this development.

Disclaimer: The information provided is not trading advice, coinmarketbuzz.com holds no liability for any investments made based on the information provided on this page. We strongly recommend independent research and/or consultation with a qualified professional before making any investment decisions.
coinmarketbuzz.com leverages advanced AI technology to analyze market data. All content is fact-checked and reviewed by our editorial team to ensure accuracy and neutrality.