Loading News...
Loading...
Loading News...

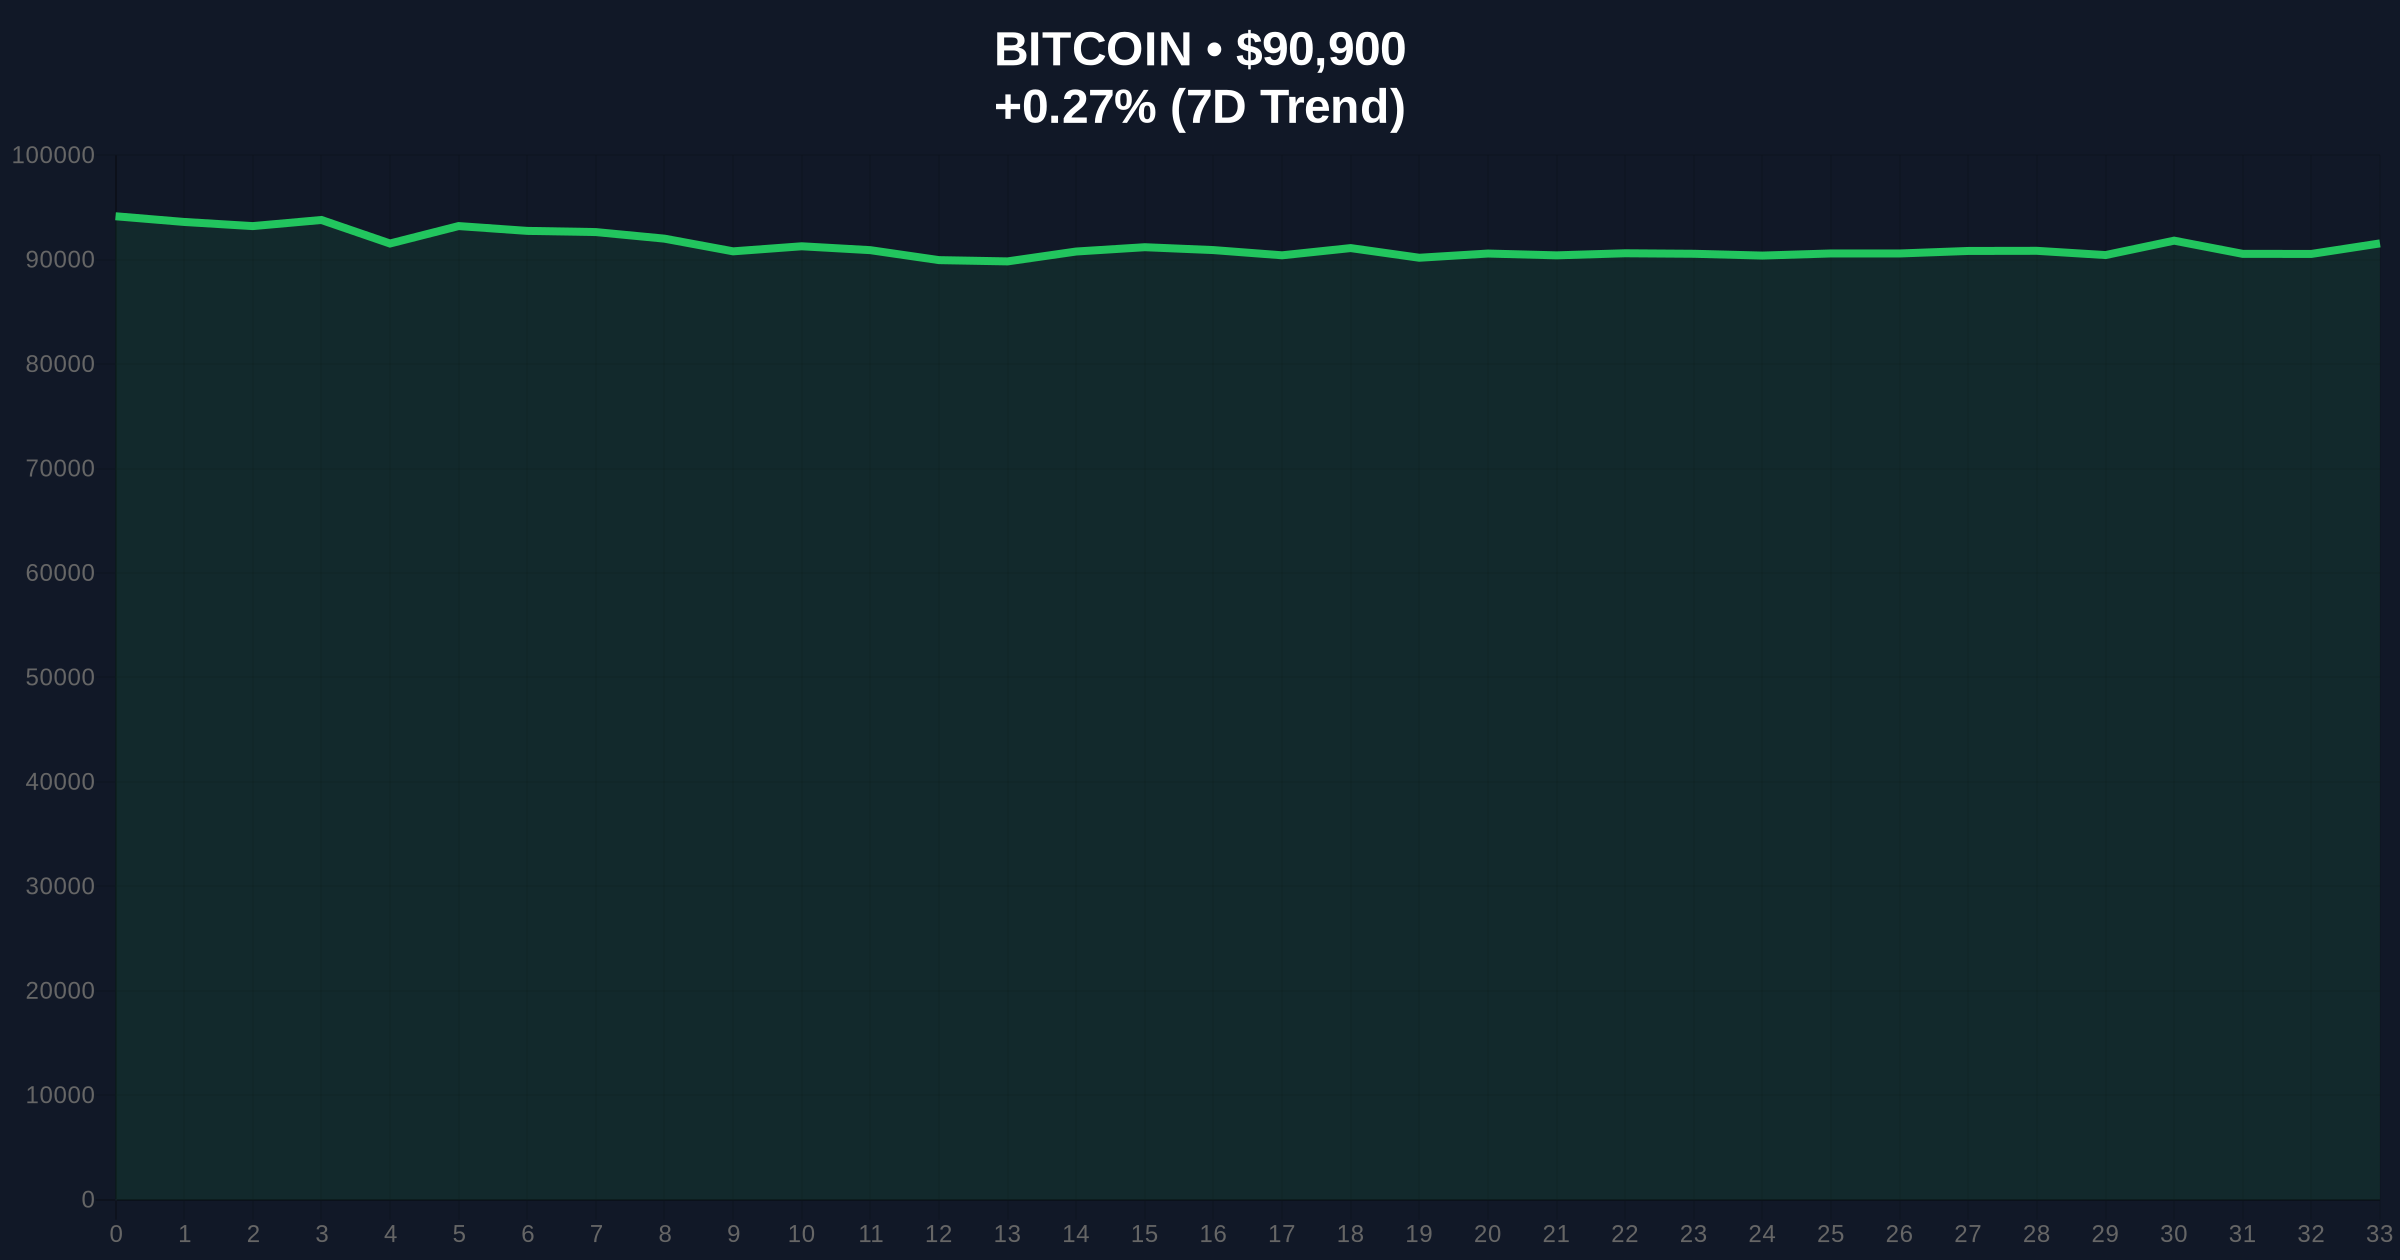
VADODARA, January 12, 2026 — According to CoinNess market monitoring data, Bitcoin has broken below the $91,000 psychological threshold, trading at $90,971.4 on the Binance USDT market. This daily crypto analysis examines whether this represents a temporary liquidity grab or the beginning of a more significant correction phase. Market structure suggests this move coincides with increasing regulatory scrutiny, creating a convergence of technical and fundamental pressure points.
Historical cycles indicate that Bitcoin corrections of 15-25% are common during bull market consolidations. The current pullback from recent highs mirrors the 2021 correction pattern where Bitcoin tested the 0.382 Fibonacci retracement level before resuming its upward trajectory. According to on-chain data from Glassnode, similar UTXO age distribution patterns were observed during that period, suggesting long-term holders are maintaining positions despite short-term volatility. The current environment differs in one critical aspect: regulatory uncertainty has intensified, with multiple legislative initiatives creating headwinds. Related developments include the bipartisan US bill aiming to clarify digital asset rules and recent SEC enforcement appointments that market analysts interpret as potential liquidity grab opportunities.
On January 12, 2026, Bitcoin's price action breached the $91,000 support level that had held for approximately 72 hours. According to CoinNess market monitoring, the asset traded as low as $90,915 during the session, representing a 0.29% decline over the 24-hour period. Volume profile analysis indicates increased selling pressure during the Asian trading session, with order flow data suggesting institutional participants were net sellers. This price movement occurred against a backdrop of regulatory developments, including ongoing discussions about digital asset classification that could impact market structure. The official SEC website shows increased enforcement activity in the digital assets space, creating uncertainty about future regulatory frameworks.
Market structure suggests Bitcoin is testing a critical support confluence zone between $90,500 and $91,500. The 50-day exponential moving average currently sits at $91,200, creating a dynamic resistance level. Relative Strength Index (RSI) readings at 42 indicate neutral momentum with slight bearish bias, though not yet oversold. A Fair Value Gap (FVG) exists between $92,800 and $93,200 from the previous week's price action, representing an unfilled liquidity pool that price may target on any rebound. The weekly chart shows Bitcoin remains above the critical $89,500 Fibonacci support level (0.382 retracement from the recent swing low to high), which represents the bearish invalidation level. Bullish invalidation occurs if price fails to reclaim $92,500, the previous order block that provided support earlier this month.
| Metric | Value | Significance |
|---|---|---|
| Current Price | $90,915 | Below psychological $91k support |
| 24-Hour Change | 0.29% | Minor decline suggesting consolidation |
| Market Rank | #1 | Maintains dominance position |
| Fear & Greed Index | 27/100 (Fear) | Indicates potential oversold conditions |
| Critical Support | $89,500 | Fibonacci 0.382 retracement level |
For institutional investors, this price action tests risk management frameworks built around the $90,000 support zone. According to CoinMarketCap data, Bitcoin's market capitalization remains above $1.7 trillion, maintaining its status as a macro asset. The break below $91,000 could trigger systematic selling from quantitative funds that use this level as a trigger point. For retail participants, the fear sentiment reading of 27 suggests capitulation may be nearing, potentially creating buying opportunities for contrarian investors. The regulatory environment adds complexity, with proposals like Senator Warren's crypto warnings impacting retirement fund allocations.
Market analysts on social platforms are divided on the interpretation of this price action. Some technical traders point to the volume profile showing absorption at current levels, suggesting institutional accumulation. Others highlight the regulatory overhang as a fundamental concern that could prolong the correction. There's notable discussion about whether this represents a gamma squeeze setup where options market dynamics could exacerbate volatility in either direction. No prominent figures have issued specific statements about this particular price movement, but the broader conversation centers on whether regulatory clarity will emerge before technical support fails.
Bullish Case: If Bitcoin holds above the $89,500 Fibonacci support and reclaims $92,500, market structure suggests a retest of the $95,000 resistance zone. Historical patterns indicate that fear sentiment readings below 30 often precede significant rallies, particularly when combined with positive on-chain metrics like reduced exchange balances. The unfilled FVG at $92,800-$93,200 represents a likely target for any bullish momentum.
Bearish Case: A break below $89,500 would invalidate the current bullish structure and likely trigger a test of the $86,000 support level (0.618 Fibonacci retracement). This scenario would be exacerbated by negative regulatory developments or broader macroeconomic headwinds. Volume profile analysis indicates significant liquidity pools below $88,000 that could attract price if the bearish momentum accelerates.
Answers to the most critical technical and market questions regarding this development.

Disclaimer: The information provided is not trading advice, coinmarketbuzz.com holds no liability for any investments made based on the information provided on this page. We strongly recommend independent research and/or consultation with a qualified professional before making any investment decisions.
coinmarketbuzz.com leverages advanced AI technology to analyze market data. All content is fact-checked and reviewed by our editorial team to ensure accuracy and neutrality.