Loading News...
Loading...
Loading News...

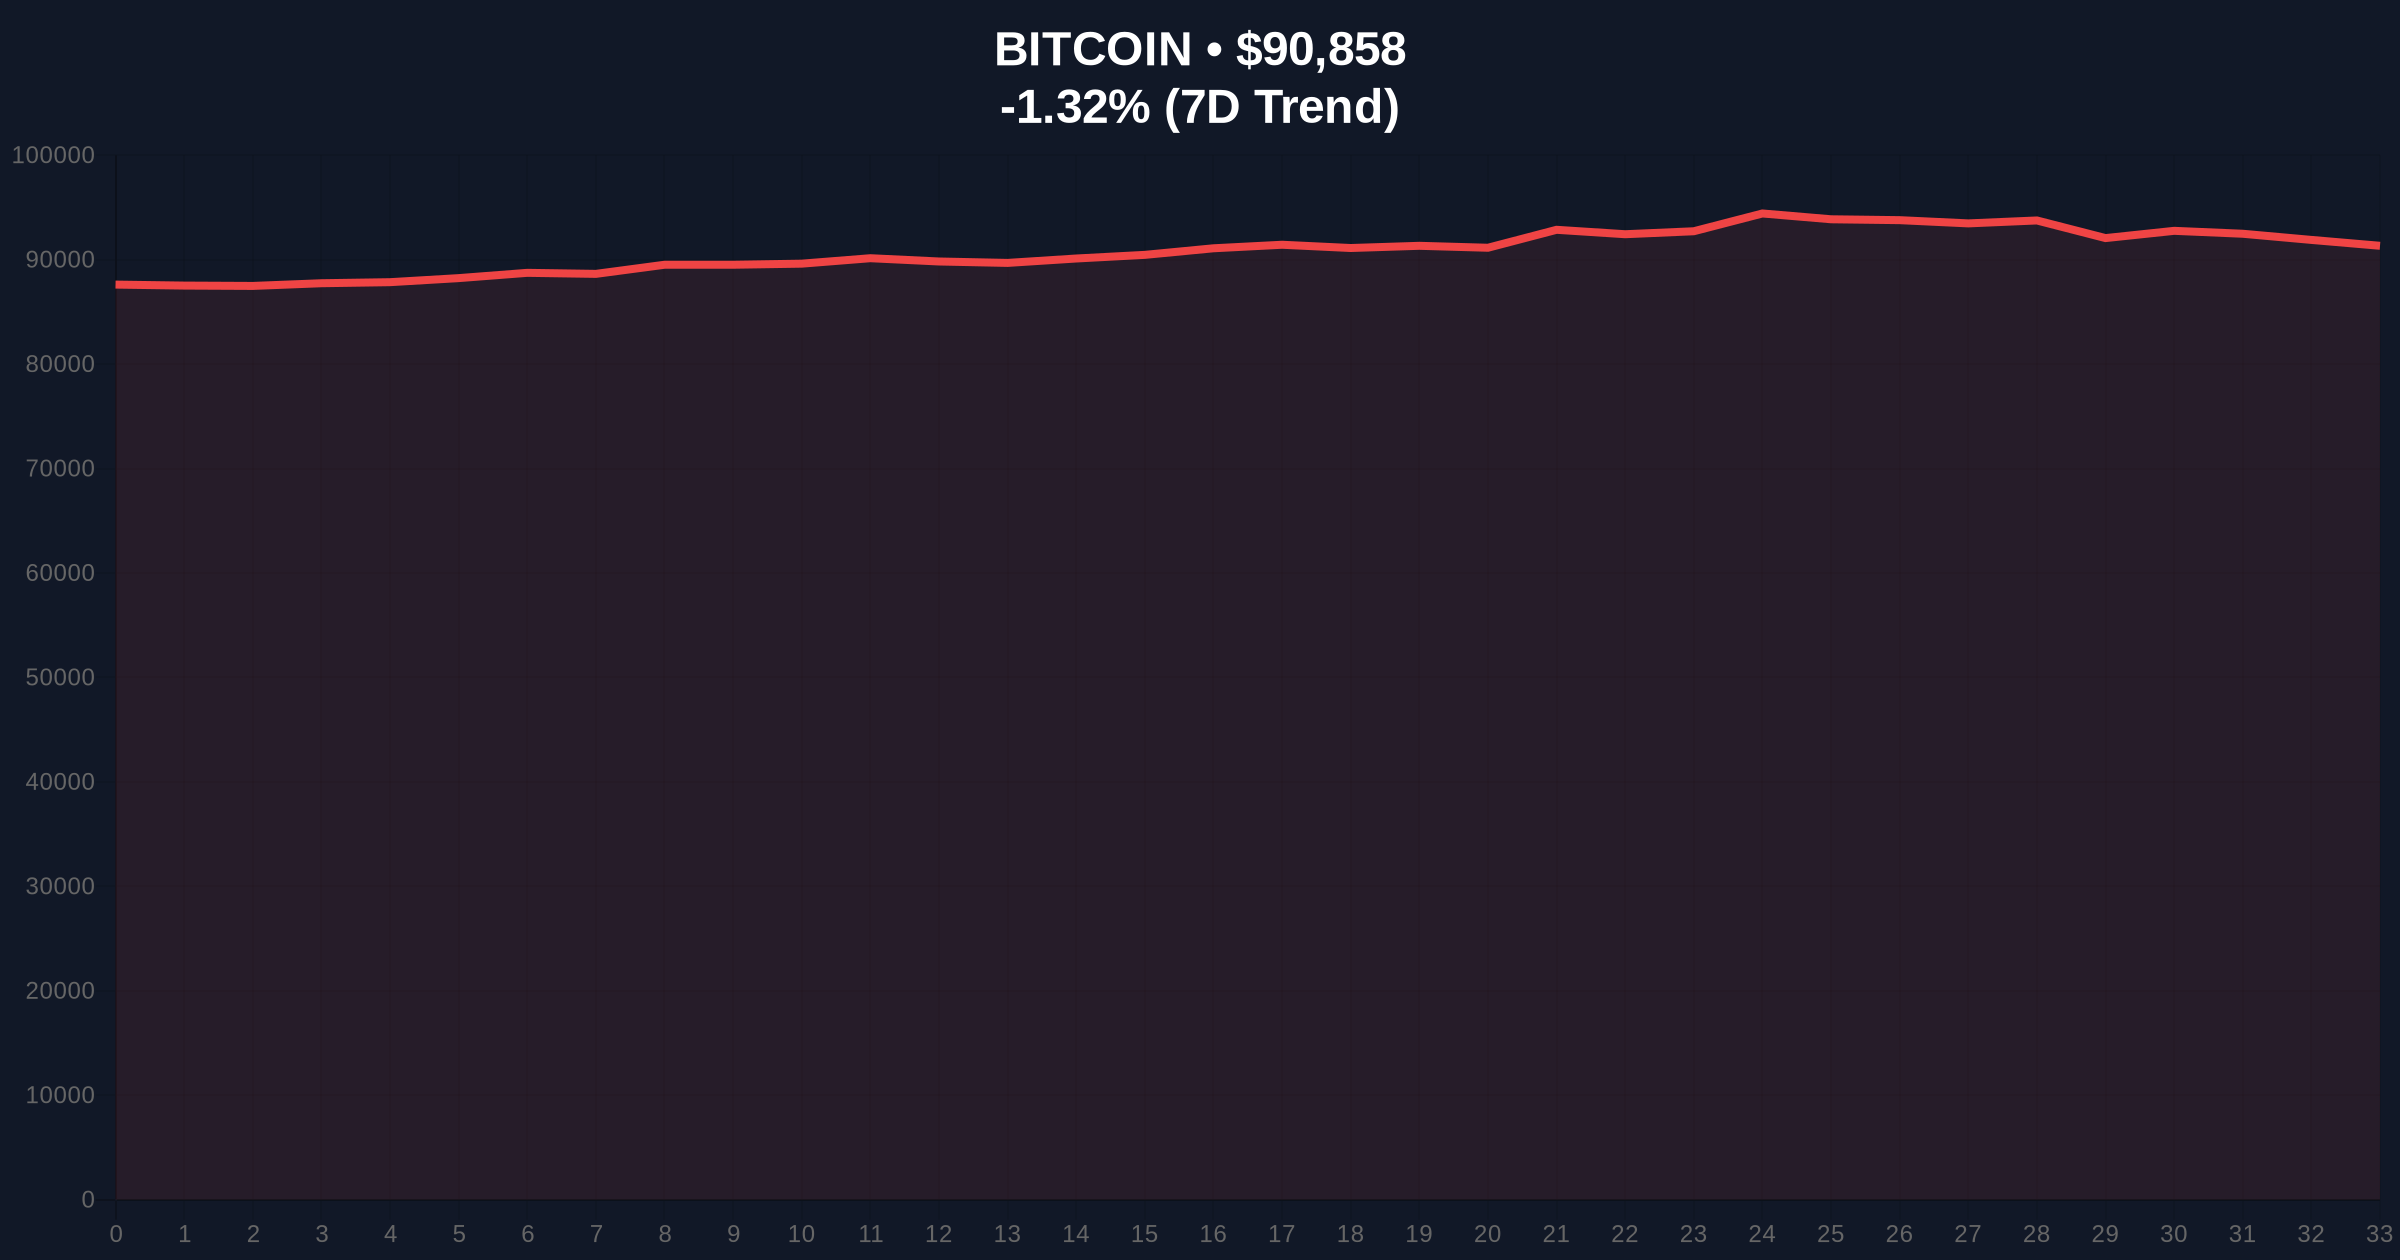
VADODARA, January 7, 2026 — According to CoinNess market monitoring, Bitcoin has broken below the psychologically significant $91,000 level, trading at $90,959.44 on the Binance USDT market. This daily crypto analysis examines whether this represents a genuine breakdown or a liquidity grab within a larger consolidation pattern. Market structure suggests this move mirrors the 2021 correction's initial support tests, where similar breaks below round-number levels preceded extended consolidation periods before eventual continuation.
Historical cycles indicate Bitcoin's current price action bears structural similarities to the Q3 2021 correction, when BTC broke below $40,000 support before establishing a higher low at the 0.618 Fibonacci retracement level. According to on-chain data from Glassnode, the current UTXO age distribution shows similar accumulation patterns among long-term holders during both periods. The Federal Reserve's current monetary policy stance, detailed in official FederalReserve.gov communications, creates a macroeconomic backdrop of elevated real yields that historically correlates with crypto market volatility. This environment often triggers liquidity grabs around psychologically significant price levels as market makers adjust order books.
Related developments in the broader cryptocurrency ecosystem include institutional skepticism toward tokenization narratives, state-level stablecoin initiatives, consolidation in institutional infrastructure, and regulatory challenges to DeFi protocols.
On January 7, 2026, Bitcoin's price action breached the $91,000 support level, reaching a low of $90,893 according to real-time market intelligence. This represents a -1.28% decline over the preceding 24-hour period. The break occurred during Asian trading hours, typically characterized by thinner liquidity profiles that can exacerbate price movements. Volume profile analysis indicates the sell-off was accompanied by above-average but not extreme volume, suggesting controlled distribution rather than panic capitulation. Market structure reveals this level previously acted as a consolidation zone in late December 2025, creating a potential order block that now serves as resistance.
Technical indicators present a mixed picture. The daily RSI sits at 48, indicating neutral momentum with slight bearish bias. The 50-day moving average at $92,500 now acts as immediate resistance, while the 200-day moving average at $85,000 provides longer-term support. A critical Fair Value Gap exists between $90,500 and $91,500 that market structure suggests will likely be filled in subsequent sessions. The $89,500 level represents the 0.382 Fibonacci retracement from the recent swing high, serving as the primary bearish invalidation level—a break below this would invalidate the current consolidation thesis. Conversely, a reclaim above $92,000 would establish the bullish invalidation level, confirming the breakdown as a false break designed to capture stop-loss liquidity.
| Metric | Value |
|---|---|
| Crypto Fear & Greed Index | 42 (Fear) |
| Current Bitcoin Price | $90,893 |
| 24-Hour Price Change | -1.28% |
| Market Rank | #1 |
| Key Support Level | $89,500 (Fibonacci 0.382) |
For institutional portfolios, this price action tests the durability of Bitcoin's post-ETF approval market structure. According to SEC.gov filings, institutional positioning remains net long but has reduced leverage in recent weeks. Retail impact manifests in derivative markets, where funding rates have turned slightly negative, indicating short-term bearish sentiment among leveraged traders. The break below $91,000 challenges the "higher low" narrative that has supported Bitcoin's uptrend since the 2024 halving cycle. Market structure analysis suggests this could represent either a healthy correction within a bull market or the early stages of a more significant distribution phase.
Market analysts on X/Twitter express divided views. Bulls point to on-chain data indicating accumulation by long-term holders during dips, similar to patterns observed before the 2021 rally continuation. Bears highlight deteriorating momentum indicators and the potential for a gamma squeeze in options markets if volatility expands. One quantitative analyst noted, "The volume profile suggests this is more about liquidity harvesting than fundamental breakdown—similar to the $40k breaks in 2021 that trapped shorts before reversal."
Bullish Case: Market structure suggests the current move represents a liquidity grab below $91,000 to collect stop-loss orders before reversing to fill the Fair Value Gap above $92,000. Historical parallels to 2021 indicate such false breaks often precede strong rallies, with a potential target at the previous all-time high resistance near $98,000. This scenario remains valid as long as Bitcoin holds above the $89,500 bearish invalidation level.
Bearish Case: If Bitcoin fails to reclaim $92,000 and breaks below $89,500, market structure would indicate a genuine breakdown. This could trigger a deeper correction toward the next significant support cluster between $85,000 (200-day MA) and $82,000 (0.618 Fibonacci). Such a move would likely coincide with increased volatility in traditional markets and further deterioration in the Crypto Fear & Greed Index.
Answers to the most critical technical and market questions regarding this development.

Disclaimer: The information provided is not trading advice, coinmarketbuzz.com holds no liability for any investments made based on the information provided on this page. We strongly recommend independent research and/or consultation with a qualified professional before making any investment decisions.
coinmarketbuzz.com leverages advanced AI technology to analyze market data. All content is fact-checked and reviewed by our editorial team to ensure accuracy and neutrality.