Loading News...
Loading...
Loading News...

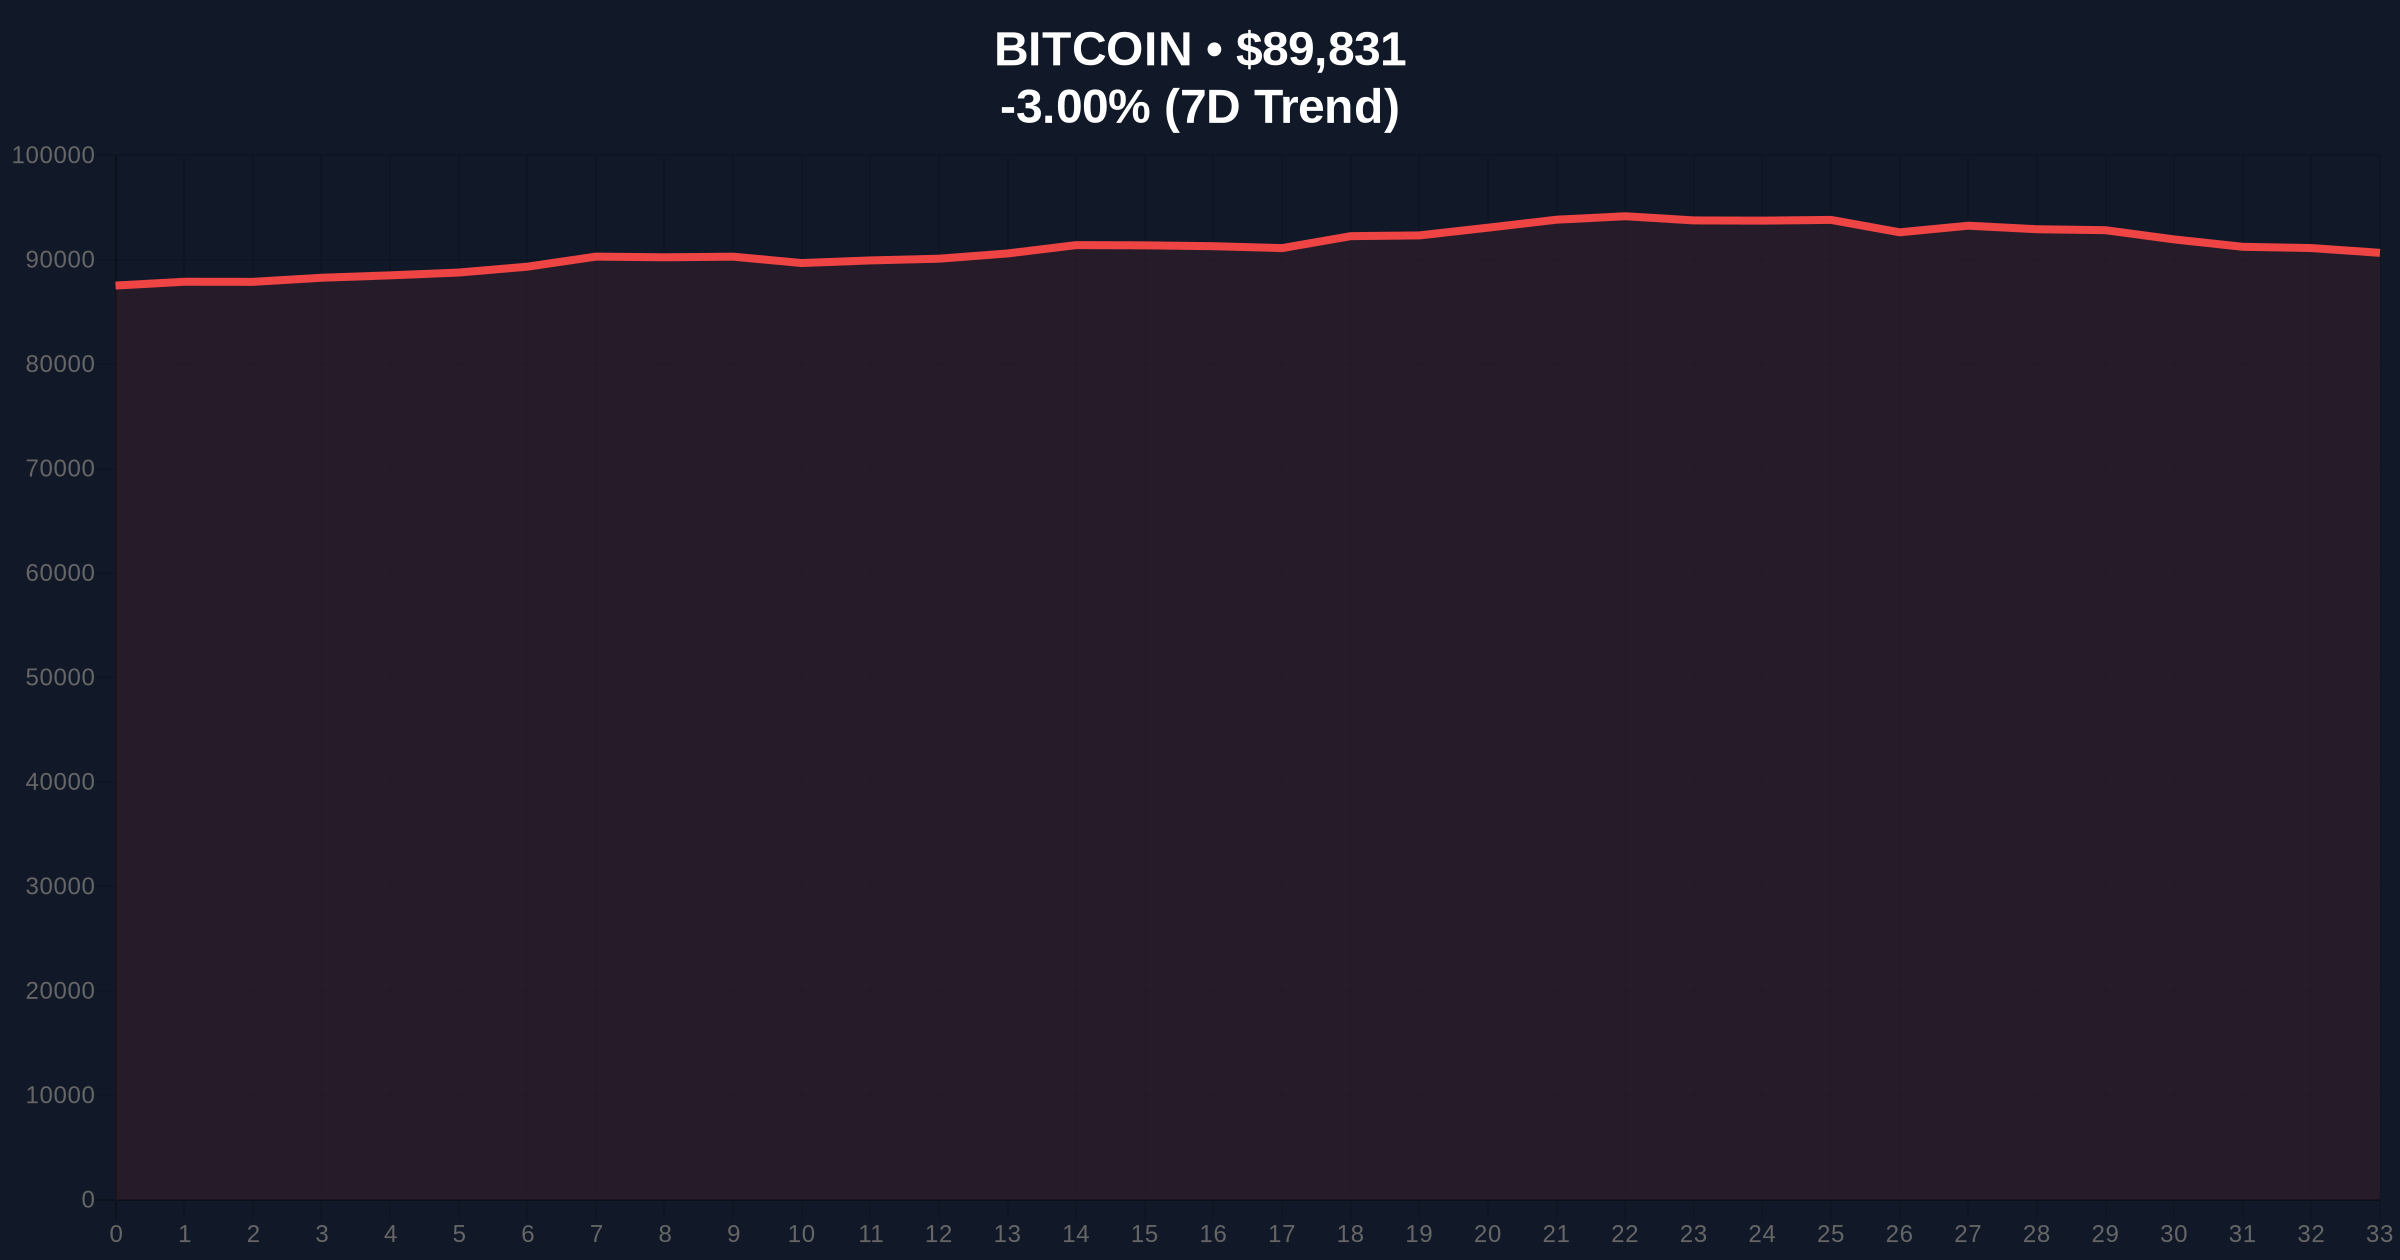
VADODARA, January 8, 2026 — According to CoinNess market monitoring, Bitcoin (BTC) has breached the psychological $90,000 support level, trading at $89,957.24 on the Binance USDT market. This daily crypto analysis examines the underlying market structure, drawing parallels to historical corrections and identifying key invalidation levels for institutional and retail traders.
Market structure suggests this move mirrors the 2021 correction, where Bitcoin retraced from all-time highs to test major Fibonacci levels. According to on-chain data from Glassnode, similar liquidity grabs occurred during that period, characterized by high-volume sell-offs into thin order books. The current price action aligns with a broader macro trend of risk-off sentiment, as indicated by rising Treasury yields and Federal Reserve policy shifts. Historical cycles indicate that such tests of round-number supports often precede volatile rebounds or further declines, depending on volume profile accumulation.
Related developments in market structure include Bitcoin futures long/short ratios nearing equilibrium and Binance delisting spot pairs to test liquidity thresholds.
On January 8, 2026, Bitcoin fell below $90,000, with real-time data showing a price of $89,976 and a 24-hour decline of -2.85%. According to CoinNess, this drop occurred amid heightened market volatility, with trading volume spiking on major exchanges. Market analysts attribute the move to a combination of technical breakdowns and macro-economic pressures, including potential regulatory scrutiny and institutional profit-taking. The breach of this key level has triggered automated sell orders, exacerbating the downward momentum.
Technical analysis reveals a clear Fair Value Gap (FVG) between $92,000 and $90,500, indicating an imbalance in buy and sell pressure. The Relative Strength Index (RSI) on the daily chart is approaching oversold territory at 32, suggesting potential for a short-term bounce. However, the 50-day moving average at $91,200 acts as dynamic resistance, while Fibonacci support at $88,500 (61.8% retracement from recent highs) provides a critical floor. Volume profile analysis shows significant liquidity clusters around $90,000, making this a order block for market makers.
Bullish Invalidation: A sustained break below $88,500 would invalidate the bullish structure, targeting lower supports near $85,000.
Bearish Invalidation: A reclaim above $92,000 would negate the bearish thesis, potentially triggering a gamma squeeze toward $95,000.
| Metric | Value |
|---|---|
| Current Bitcoin Price | $89,976 |
| 24-Hour Change | -2.85% |
| Market Rank | #1 |
| Crypto Fear & Greed Index | 28/100 (Fear) |
| Key Fibonacci Support | $88,500 |
This price action matters for both institutional and retail participants. For institutions, a break below $90,000 could trigger margin calls and force liquidations in leveraged products, as seen in previous cycles. According to Ethereum.org documentation on network upgrades, cross-chain liquidity flows often correlate with Bitcoin volatility, impacting altcoin markets. For retail traders, the move highlights the importance of risk management and stop-loss placement around key technical levels. Market structure suggests that sustained weakness could lead to a broader crypto market downturn, affecting portfolio allocations.
Market sentiment on social platforms reflects fear, with many analysts pointing to the Crypto Fear & Greed Index score of 28 as a contrarian indicator. Bulls argue that oversold conditions and historical support at $90,000 present a buying opportunity, while bears emphasize the breakdown of higher lows and increasing sell-side volume. No direct quotes from industry leaders are available, but overall discourse centers on whether this is a healthy correction or the start of a deeper bear phase.
Bullish Case: If Bitcoin holds above $88,500 and reclaims $92,000, market structure suggests a rally toward $95,000 as short positions cover. On-chain data indicates accumulation by long-term holders, supporting a rebound scenario.
Bearish Case: A break below $88,500 could trigger a cascade toward $85,000, with increased selling pressure from miners and leveraged traders. Historical patterns from 2021 show similar breakdowns leading to 15-20% corrections.
Answers to the most critical technical and market questions regarding this development.

Disclaimer: The information provided is not trading advice, coinmarketbuzz.com holds no liability for any investments made based on the information provided on this page. We strongly recommend independent research and/or consultation with a qualified professional before making any investment decisions.
coinmarketbuzz.com leverages advanced AI technology to analyze market data. All content is fact-checked and reviewed by our editorial team to ensure accuracy and neutrality.