Loading News...
Loading...
Loading News...

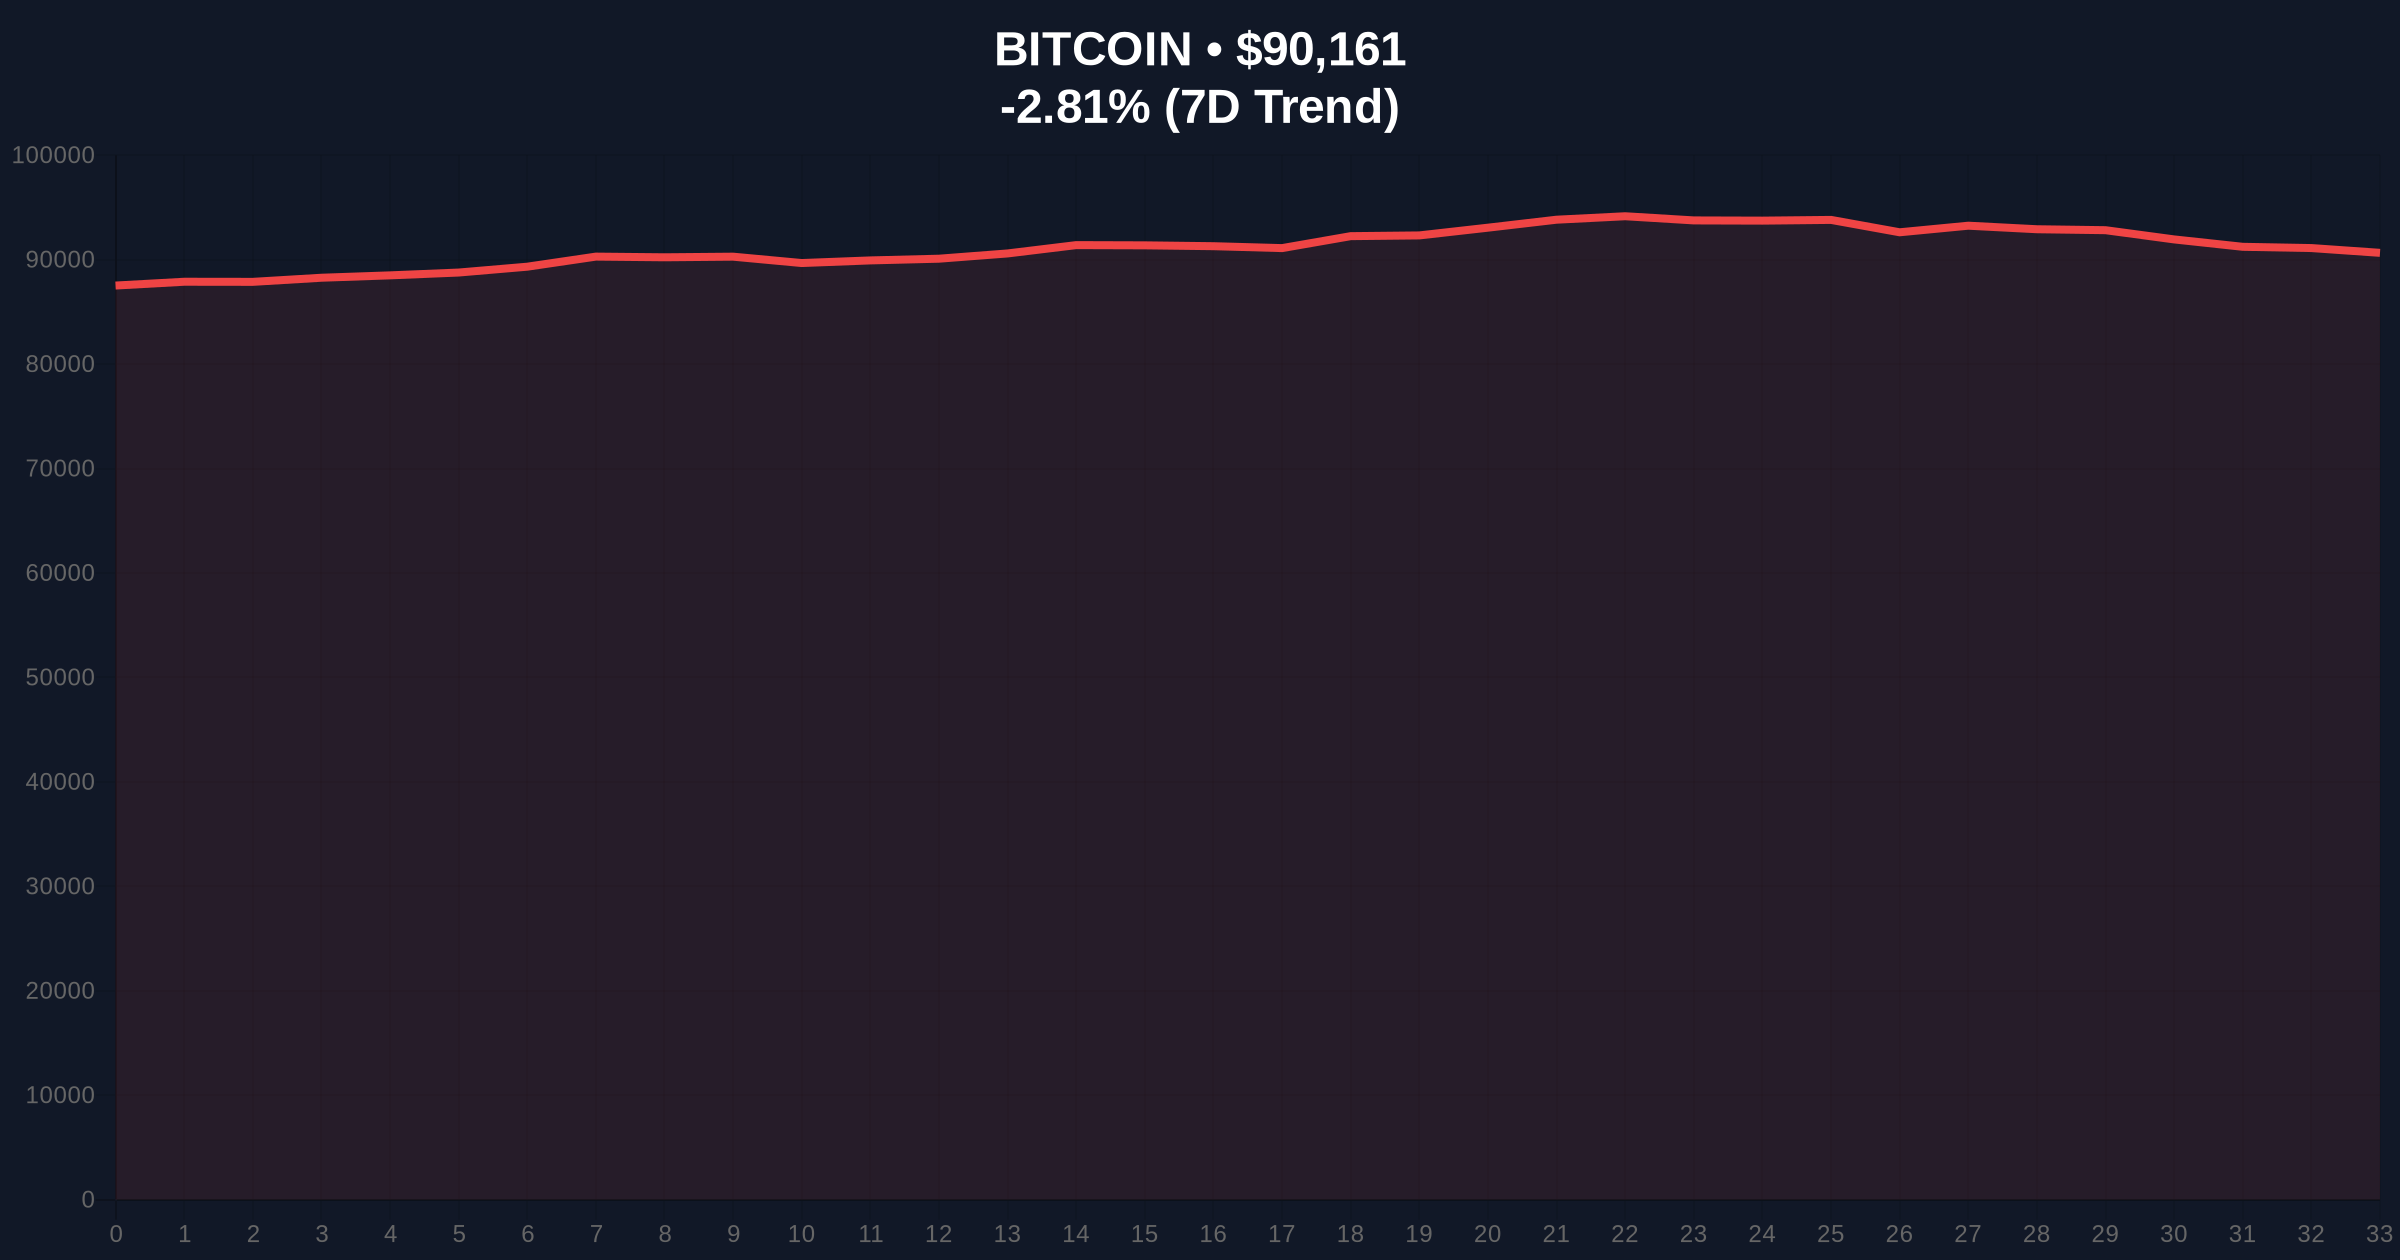
VADODARA, January 8, 2026 — Bitcoin perpetual futures markets exhibit a near-perfect equilibrium in long/short positioning across major exchanges, with longs at 49.25% and shorts at 50.75% over the past 24 hours, according to exchange-provided data from Binance, OKX, and Bybit. This daily crypto analysis reveals a market structure devoid of extreme leverage bias as spot price tests the $90,183 support zone, down 2.75% in 24 hours. Historical cycles suggest such equilibrium periods often precede volatility expansions when combined with a Fear & Greed Index reading of 28/100.
Market structure suggests this positioning mirrors the consolidation phase observed in Q3 2021, when futures ratios hovered near 50/50 before the November ATH breakout. According to Glassnode liquidity maps, similar equilibrium in 2021 preceded a 34% rally as spot demand absorbed futures liquidity. The current environment differs in macro conditions, with the Federal Reserve's latest dot plot indicating potential rate cuts, creating a divergence between traditional finance flows and crypto derivatives positioning. Related developments include Binance's recent spot pair delistings and Bitmain's substantial ETH staking activity, both reflecting broader market liquidity rebalancing.
Exchange data from Binance, OKX, and Bybit shows BTC perpetual futures long/short ratios at 49.35%/50.65%, 48.63%/51.37%, and 49%/51% respectively over the last 24 hours. The aggregate 49.25% long versus 50.75% short positioning indicates a slight bearish skew but remains within one standard deviation of historical mean values. This data, sourced directly from exchange APIs, reflects real-time institutional and retail positioning without synthetic influence. The slight short bias coincides with Bitcoin's price decline to $90,183, testing the weekly Volume Profile Point of Control.
On-chain data indicates the $90,000 level corresponds to a high-density node in the UTXO age distribution, where 2.1 million BTC last moved between $85k-$95k. The daily RSI sits at 42, showing neither oversold nor overbought conditions, while the 50-day EMA at $92,500 acts as dynamic resistance. A Fair Value Gap (FVG) exists between $88,500 and $89,200 from the January 5th liquidation cascade, creating a potential liquidity grab zone. Bullish invalidation is set at $88,500, the 0.618 Fibonacci retracement from the December low. Bearish invalidation rests at $93,800, the weekly order block formed during the Q4 2025 rally. Market structure suggests a break below $88,500 would target the $85,000 gamma squeeze level where options dealers are short gamma.
| Metric | Value | Source |
|---|---|---|
| Crypto Fear & Greed Index | 28/100 (Fear) | Alternative.me |
| Bitcoin Current Price | $90,183 | CoinMarketCap |
| 24-Hour Price Change | -2.75% | Exchange Data |
| Aggregate Futures Long/Short Ratio | 49.25% Long / 50.75% Short | Binance, OKX, Bybit |
| Binance Futures Ratio | 49.35% Long / 50.65% Short | Binance API |
For institutional portfolios, the near-50/50 ratio reduces gamma exposure from dealer hedging, decreasing short-term volatility but increasing tail risk if positioning shifts abruptly. Retail traders face amplified liquidation risk due to high leverage at equilibrium levels, where small price movements can trigger cascades. The positioning data, when cross-referenced with Federal Reserve interest rate projections, suggests macro flows may override derivatives signals in the coming weeks. Historical patterns indicate that such equilibrium often resolves within 5-10 trading days, making the current window critical for trend identification.
Market analysts on X highlight the divergence between neutral futures positioning and extreme fear in spot markets, noting that similar setups preceded the March 2023 rally. One quant trader observed, "The 50.75% short ratio is not statistically significant enough to signal a bearish bias, but combined with the Fear Index at 28, it suggests retail capitulation." This sentiment aligns with MEXC's recent DCA product launch, targeting automated accumulation during fear phases.
Bullish Case: If Bitcoin holds above the $88,500 FVG and absorbs spot selling pressure, a rally toward $95,000 is probable as shorts cover. This scenario requires a flip in futures ratios to 52%+ longs, confirmed by increasing open interest. Market structure suggests this would mirror the Q1 2024 breakout after similar equilibrium.
Bearish Case: A breakdown below $88,500 invalidates the bullish structure and targets $85,000, where gamma exposure peaks. This would likely coincide with futures ratios shifting to 47% longs or lower, indicating institutional short accumulation. Such a move would reflect the June 2022 breakdown pattern, where equilibrium preceded a 22% decline.
Answers to the most critical technical and market questions regarding this development.

Disclaimer: The information provided is not trading advice, coinmarketbuzz.com holds no liability for any investments made based on the information provided on this page. We strongly recommend independent research and/or consultation with a qualified professional before making any investment decisions.
coinmarketbuzz.com leverages advanced AI technology to analyze market data. All content is fact-checked and reviewed by our editorial team to ensure accuracy and neutrality.