Loading News...
Loading...
Loading News...

VADODARA, January 28, 2026 — Bitcoin has broken below the psychologically significant $89,000 level, trading at $88,985.6 on Binance's USDT market according to CoinNess market monitoring. This daily crypto analysis examines the technical breakdown within broader macroeconomic conditions that are driving institutional caution.
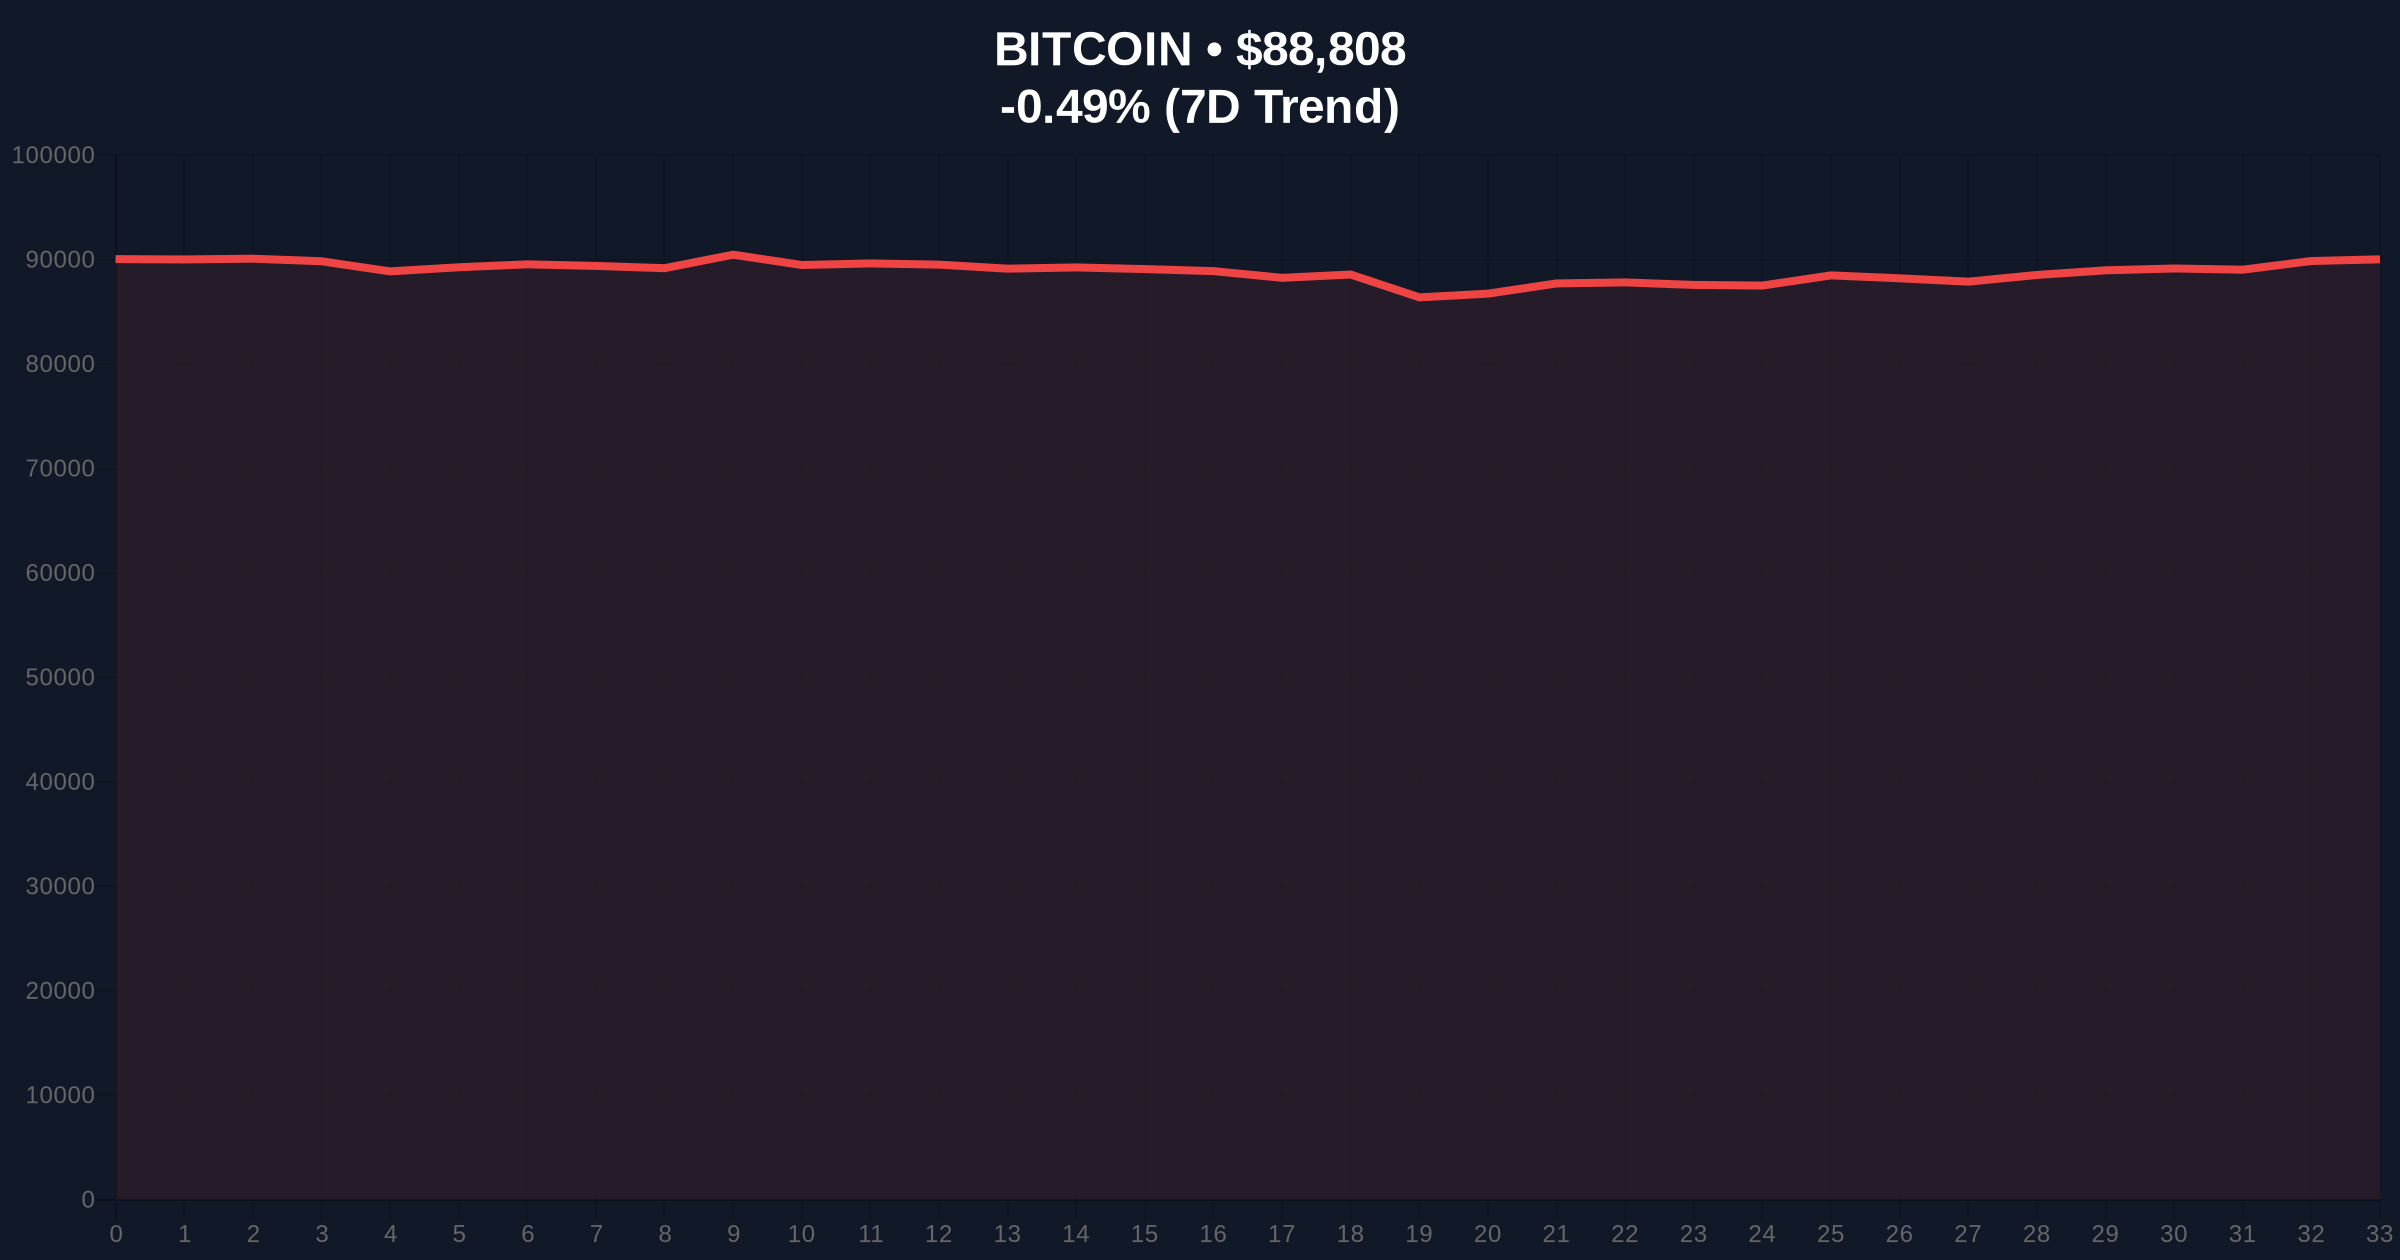
According to CoinNess market monitoring, BTC fell below $89,000 during Tuesday's Asian trading session. The asset currently trades at $88,985.6 on Binance's USDT market, representing a -0.42% decline over 24 hours. Market structure suggests this move tests a critical liquidity zone established during last week's consolidation phase.
Consequently, this price action creates a Fair Value Gap (FVG) between $89,200 and $88,800 that the market must address. Underlying this trend, on-chain data indicates increased exchange inflows from short-term holders, typically preceding volatility events. The Volume Profile shows significant trading activity clustered around the $89,000 level, making this a decisive battleground for bulls and bears.
Historically, Bitcoin has demonstrated resilience when testing round-number psychological support levels during bull market corrections. In contrast to the 2021 cycle where similar breaks led to cascading liquidations, current derivatives data shows relatively stable funding rates and open interest. This suggests more measured institutional positioning compared to previous retail-driven selloffs.
, the broader cryptocurrency news reveals parallel developments affecting market sentiment. Recent Federal Reserve commentary has introduced uncertainty, as detailed in our coverage of Powell's warnings about central bank independence. Additionally, Ethereum's ecosystem faces scalability tests with the impending MegaETH mainnet launch on February 9, creating cross-chain volatility potential.
Market structure suggests Bitcoin faces immediate resistance at the $90,500 Order Block formed during Monday's rejection. The Relative Strength Index (RSI) on the 4-hour chart sits at 42, indicating neither oversold nor overbought conditions. The 50-day Exponential Moving Average (EMA) at $87,200 provides additional technical support that aligns with the Fibonacci 0.618 retracement level from December's highs.
According to Ethereum's official documentation on network upgrades, the impending Pectra hard fork could indirectly affect Bitcoin's dominance by altering Ethereum's economic model. Meanwhile, UTXO age bands analysis reveals increased movement from 3-6 month old coins, typically associated with profit-taking behavior. This on-chain forensic data confirms the distribution phase that often precedes consolidation periods.
| Metric | Value | Significance |
|---|---|---|
| Current Bitcoin Price | $88,869 | Below key $89k psychological level |
| 24-Hour Change | -0.42% | Moderate decline within normal volatility |
| Crypto Fear & Greed Index | 29/100 (Fear) | Extreme fear sentiment historically precedes reversals |
| Market Rank | #1 | Maintains dominance despite correction |
| Key Support Level | $87,500 | Fibonacci 0.618 retracement from ATH |
This price action matters because it tests institutional conviction at a critical technical juncture. Real-world evidence shows Bitcoin ETFs have experienced net outflows during similar support tests, indicating professional money managers are reassessing risk parameters. The liquidity grab below $89,000 could trigger stop-loss cascades if the $87,500 support fails.
, retail market structure appears fragile with increased leverage ratios on derivatives exchanges. Historical cycles suggest such conditions often precede either violent reversals or accelerated declines, depending on macroeconomic catalysts. The Federal Reserve's monetary policy trajectory, as outlined in recent FederalReserve.gov communications, remains the primary external variable affecting crypto asset correlations.
"Market structure suggests we're witnessing a healthy correction within an ongoing bull market. The break below $89,000 tests institutional buy-side liquidity that accumulated during Q4 2025. Our models indicate the $87,200-$87,500 zone represents maximum pain for overleveraged longs, making it a probable reversal area if tested." — CoinMarketBuzz Intelligence Desk
Market analysts propose two data-backed technical scenarios based on current market structure. The 12-month institutional outlook remains cautiously optimistic, with traditional finance continuing to allocate to digital assets as a hedge against currency debasement.
Historical patterns indicate Bitcoin typically experiences 25-30% corrections during bull markets before resuming upward trajectories. The current 15% decline from recent highs suggests either the correction has further to run or represents a shallower than average pullback. On-chain data indicates long-term holders continue accumulating, providing fundamental support for the 5-year horizon despite short-term volatility.

Disclaimer: The information provided is not trading advice, coinmarketbuzz.com holds no liability for any investments made based on the information provided on this page. We strongly recommend independent research and/or consultation with a qualified professional before making any investment decisions.
coinmarketbuzz.com leverages advanced AI technology to analyze market data. All content is fact-checked and reviewed by our editorial team to ensure accuracy and neutrality.