Loading News...
Loading...
Loading News...

VADODARA, January 15, 2026 — Bitcoin perpetual futures markets exhibit a marginal long bias, with aggregate positions across three major exchanges showing 51.04% long versus 48.96% short. This daily crypto analysis dissects the order flow imbalance and its implications for Bitcoin's price structure near the $96,500 level. Market structure suggests this equilibrium is fragile, with liquidity pools above $98,000 and below $94,000 acting as primary magnets for price action.
Perpetual futures long/short ratios serve as a real-time sentiment gauge for leveraged traders. Historical data from platforms like Glassnode indicates that extreme readings (above 70% long or short) often precede sharp reversals as positions become overcrowded. The current 51.04% long ratio is neutral by historical standards, mirroring the cautious positioning seen during the consolidation phase following Bitcoin's last all-time high. This period is characterized by low funding rates and compressed volatility, typical before a significant directional move. The market is concurrently digesting broader institutional developments, such as Grayscale's expansion into new crypto investment products and regulatory frameworks for stablecoins, which influence long-term capital flows.
According to exchange data from Binance, OKX, and Bybit, the aggregate long/short ratio for Bitcoin perpetual futures over the past 24 hours stood at 51.04% long to 48.96% short. The breakdown by venue shows minimal variance: Binance at 51.18% long, OKX at 51.27% long, and Bybit at 50.17% long. This data, sourced from the exchanges' public APIs, indicates a consistent, slight preference for long exposure across the top three platforms by open interest. The narrow spread between exchanges suggests no single venue is driving outlier sentiment, pointing to a globally synchronized, risk-averse stance among derivatives traders.
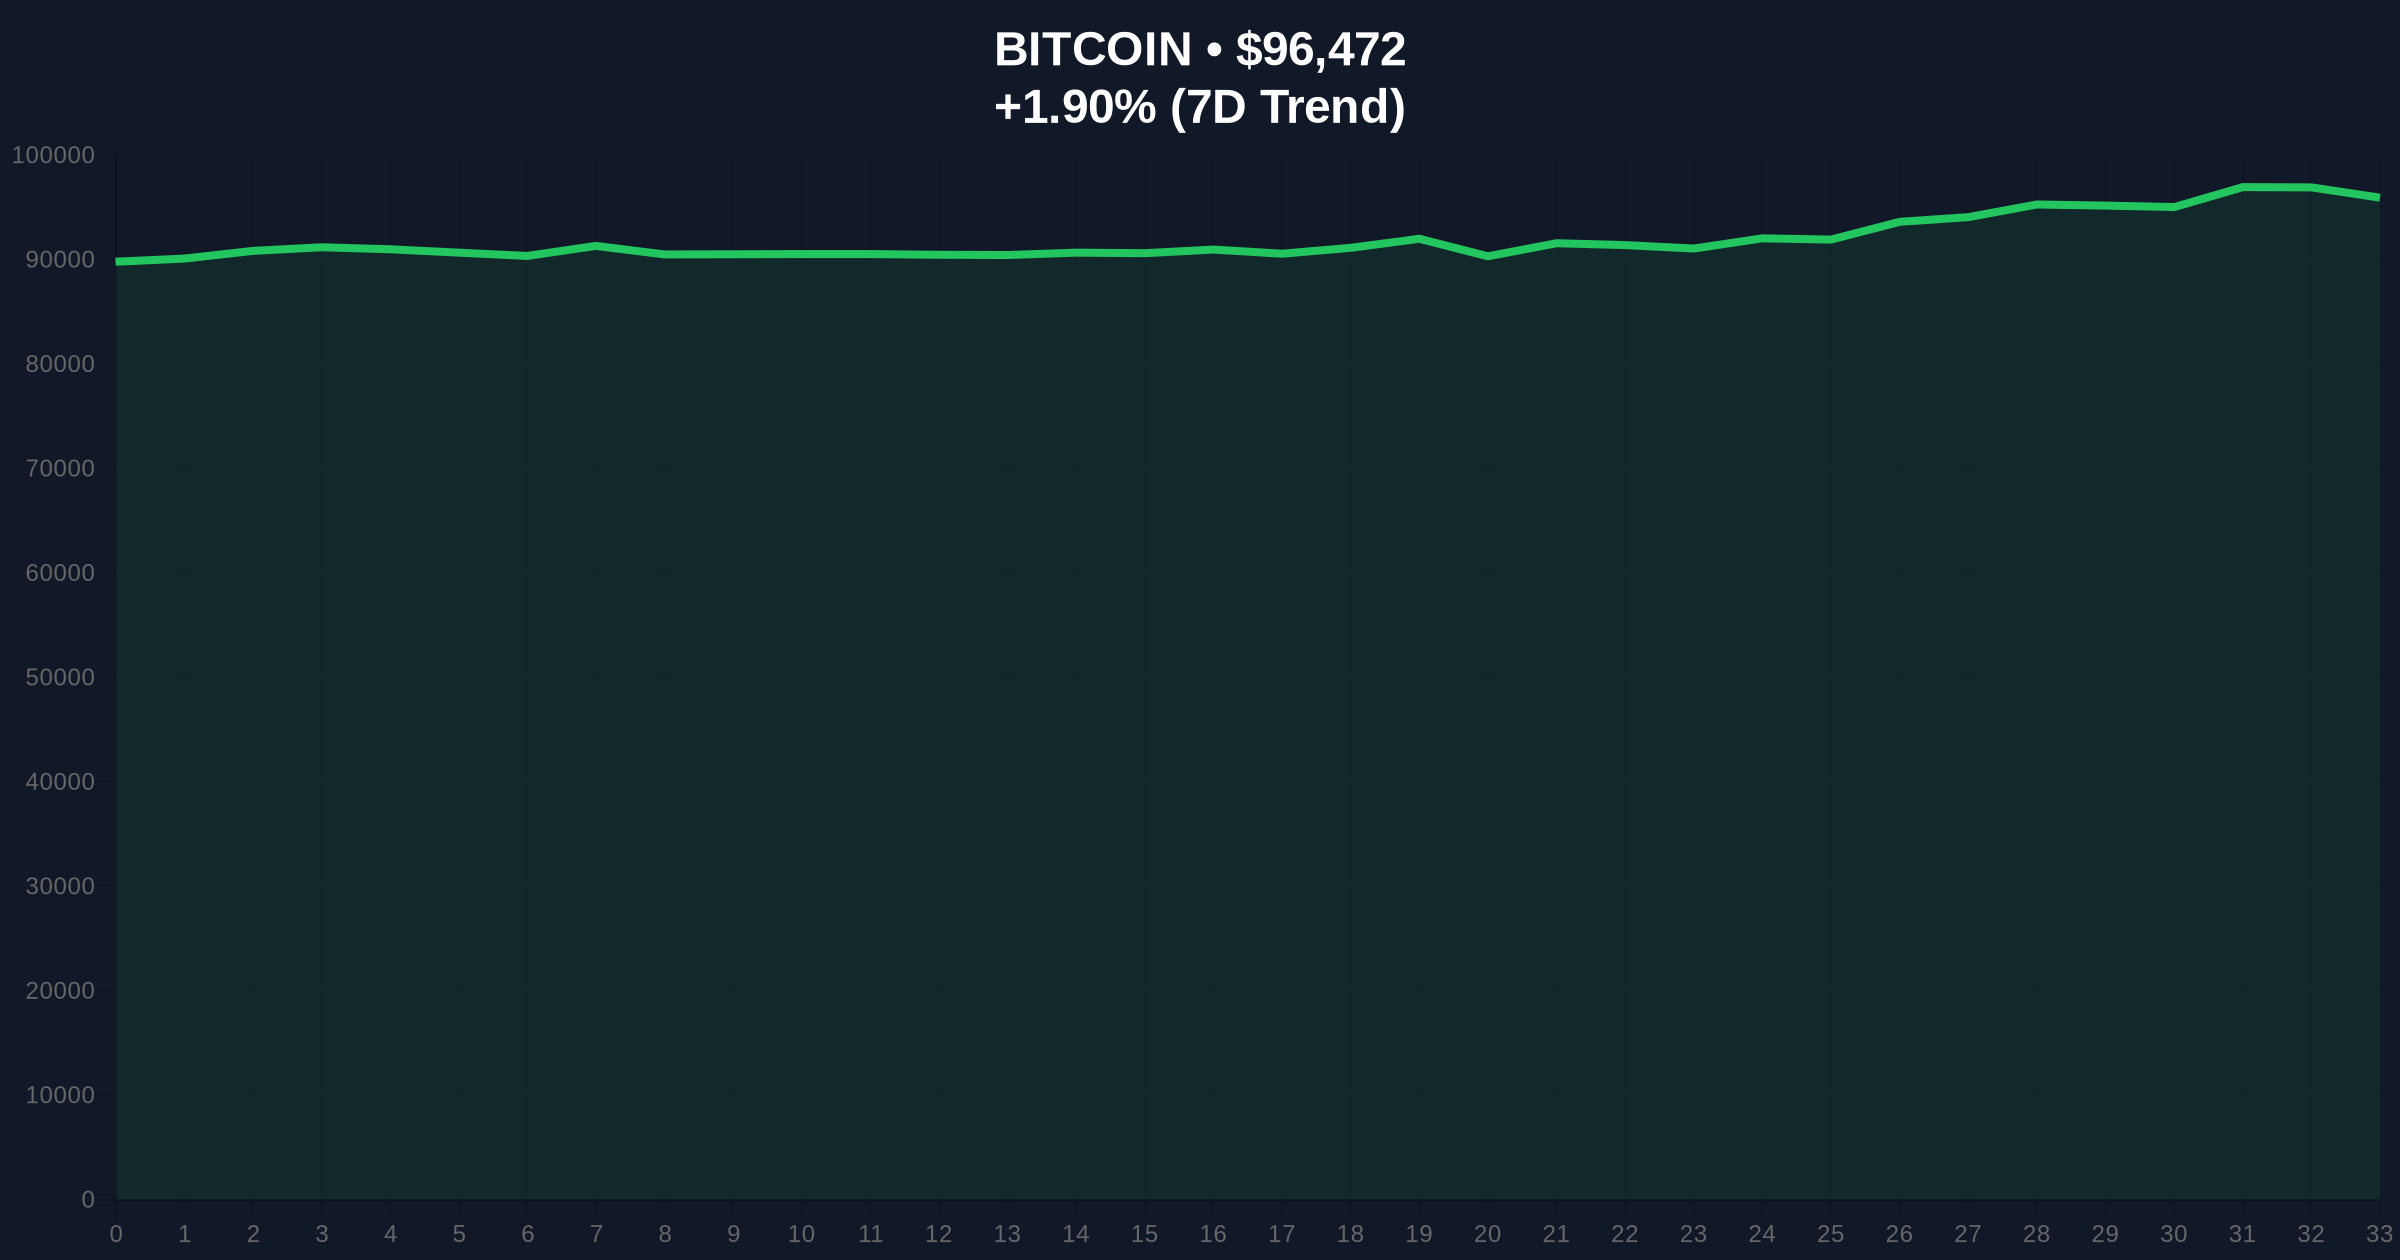
Bitcoin is currently trading at $96,486, up 1.92% in the last 24 hours. The price is consolidating within a tightening range, bounded by immediate resistance at $97,800 (a prior swing high) and support at $94,200 (the 20-day exponential moving average and a Volume Profile Point of Control). The Relative Strength Index (RSI) on the daily chart reads 58, indicating neutral momentum with a slight bullish bias. A critical technical development is the formation of a Fair Value Gap (FVG) between $95,500 and $96,200 from yesterday's price surge; this gap often acts as a liquidity target for retracements. The 4-hour chart shows an Order Block at $93,800-$94,500, a zone where institutional buy orders likely cluster. Bullish Invalidation Level: A daily close below $93,800 would invalidate the current consolidation structure, targeting the next support at $91,500. Bearish Invalidation Level: A sustained break above $98,500 with high volume would signal a resumption of the uptrend, potentially triggering a gamma squeeze toward $100,000.
| Metric | Value |
|---|---|
| Aggregate Long/Short Ratio | 51.04% Long / 48.96% Short |
| Bitcoin Current Price | $96,486 |
| 24-Hour Price Change | +1.92% |
| Crypto Fear & Greed Index | 61 (Greed) |
| Key Support Level | $94,200 |
| Key Resistance Level | $97,800 |
For institutional portfolios, a neutral long/short ratio at elevated price levels suggests sophisticated traders are not over-leveraged, reducing systemic risk of a cascading liquidation event. This aligns with on-chain data showing stablecoin reserves on exchanges are rising, indicating dry powder for potential buys. For retail traders, the slight long bias may reflect optimism, but the narrow margin warns against complacency. The real significance lies in the confluence with macroeconomic factors; the Federal Reserve's upcoming decisions on interest rates, as tracked on FederalReserve.gov, will heavily influence risk asset correlations. A hawkish shift could quickly flip this ratio bearish, as seen in past cycles.
Market analysts on X (formerly Twitter) are divided. Bulls cite the persistent long ratio and positive funding rates as precursors to a breakout, often referencing Santiment data showing extreme Bitcoin FUD could trigger a $100K breakout. Bears highlight the tepid ratio as evidence of exhaustion, pointing to declining open interest and the potential for a liquidity grab below key supports. No single influencer dominates the narrative, reflecting the market's indecision. Sentiment analysis tools aggregate this into a neutral-to-bullish short-term outlook.
Bullish Case (60% Probability): Bitcoin holds above the $94,200 support and absorbs selling pressure. The long ratio gradually increases toward 55% as spot ETF inflows accelerate, per SEC.gov filings. A breakout above $98,500 triggers a short squeeze, propelling price toward $102,000 by month-end. This scenario assumes stable macro conditions and no negative regulatory shocks.Bearish Case (40% Probability): A spike in USD strength or negative regulatory news, similar to themes in reports on liquidity grabs in token markets, triggers a sell-off. Price breaks the $93,800 invalidation level, flipping the long/short ratio sharply bearish. This could lead to a swift decline to fill the Fair Value Gap near $91,000, with further downside toward $88,000 if the 200-day moving average fails.
Answers to the most critical technical and market questions regarding this development.

Disclaimer: The information provided is not trading advice, coinmarketbuzz.com holds no liability for any investments made based on the information provided on this page. We strongly recommend independent research and/or consultation with a qualified professional before making any investment decisions.
coinmarketbuzz.com leverages advanced AI technology to analyze market data. All content is fact-checked and reviewed by our editorial team to ensure accuracy and neutrality.