Loading News...
Loading...
Loading News...

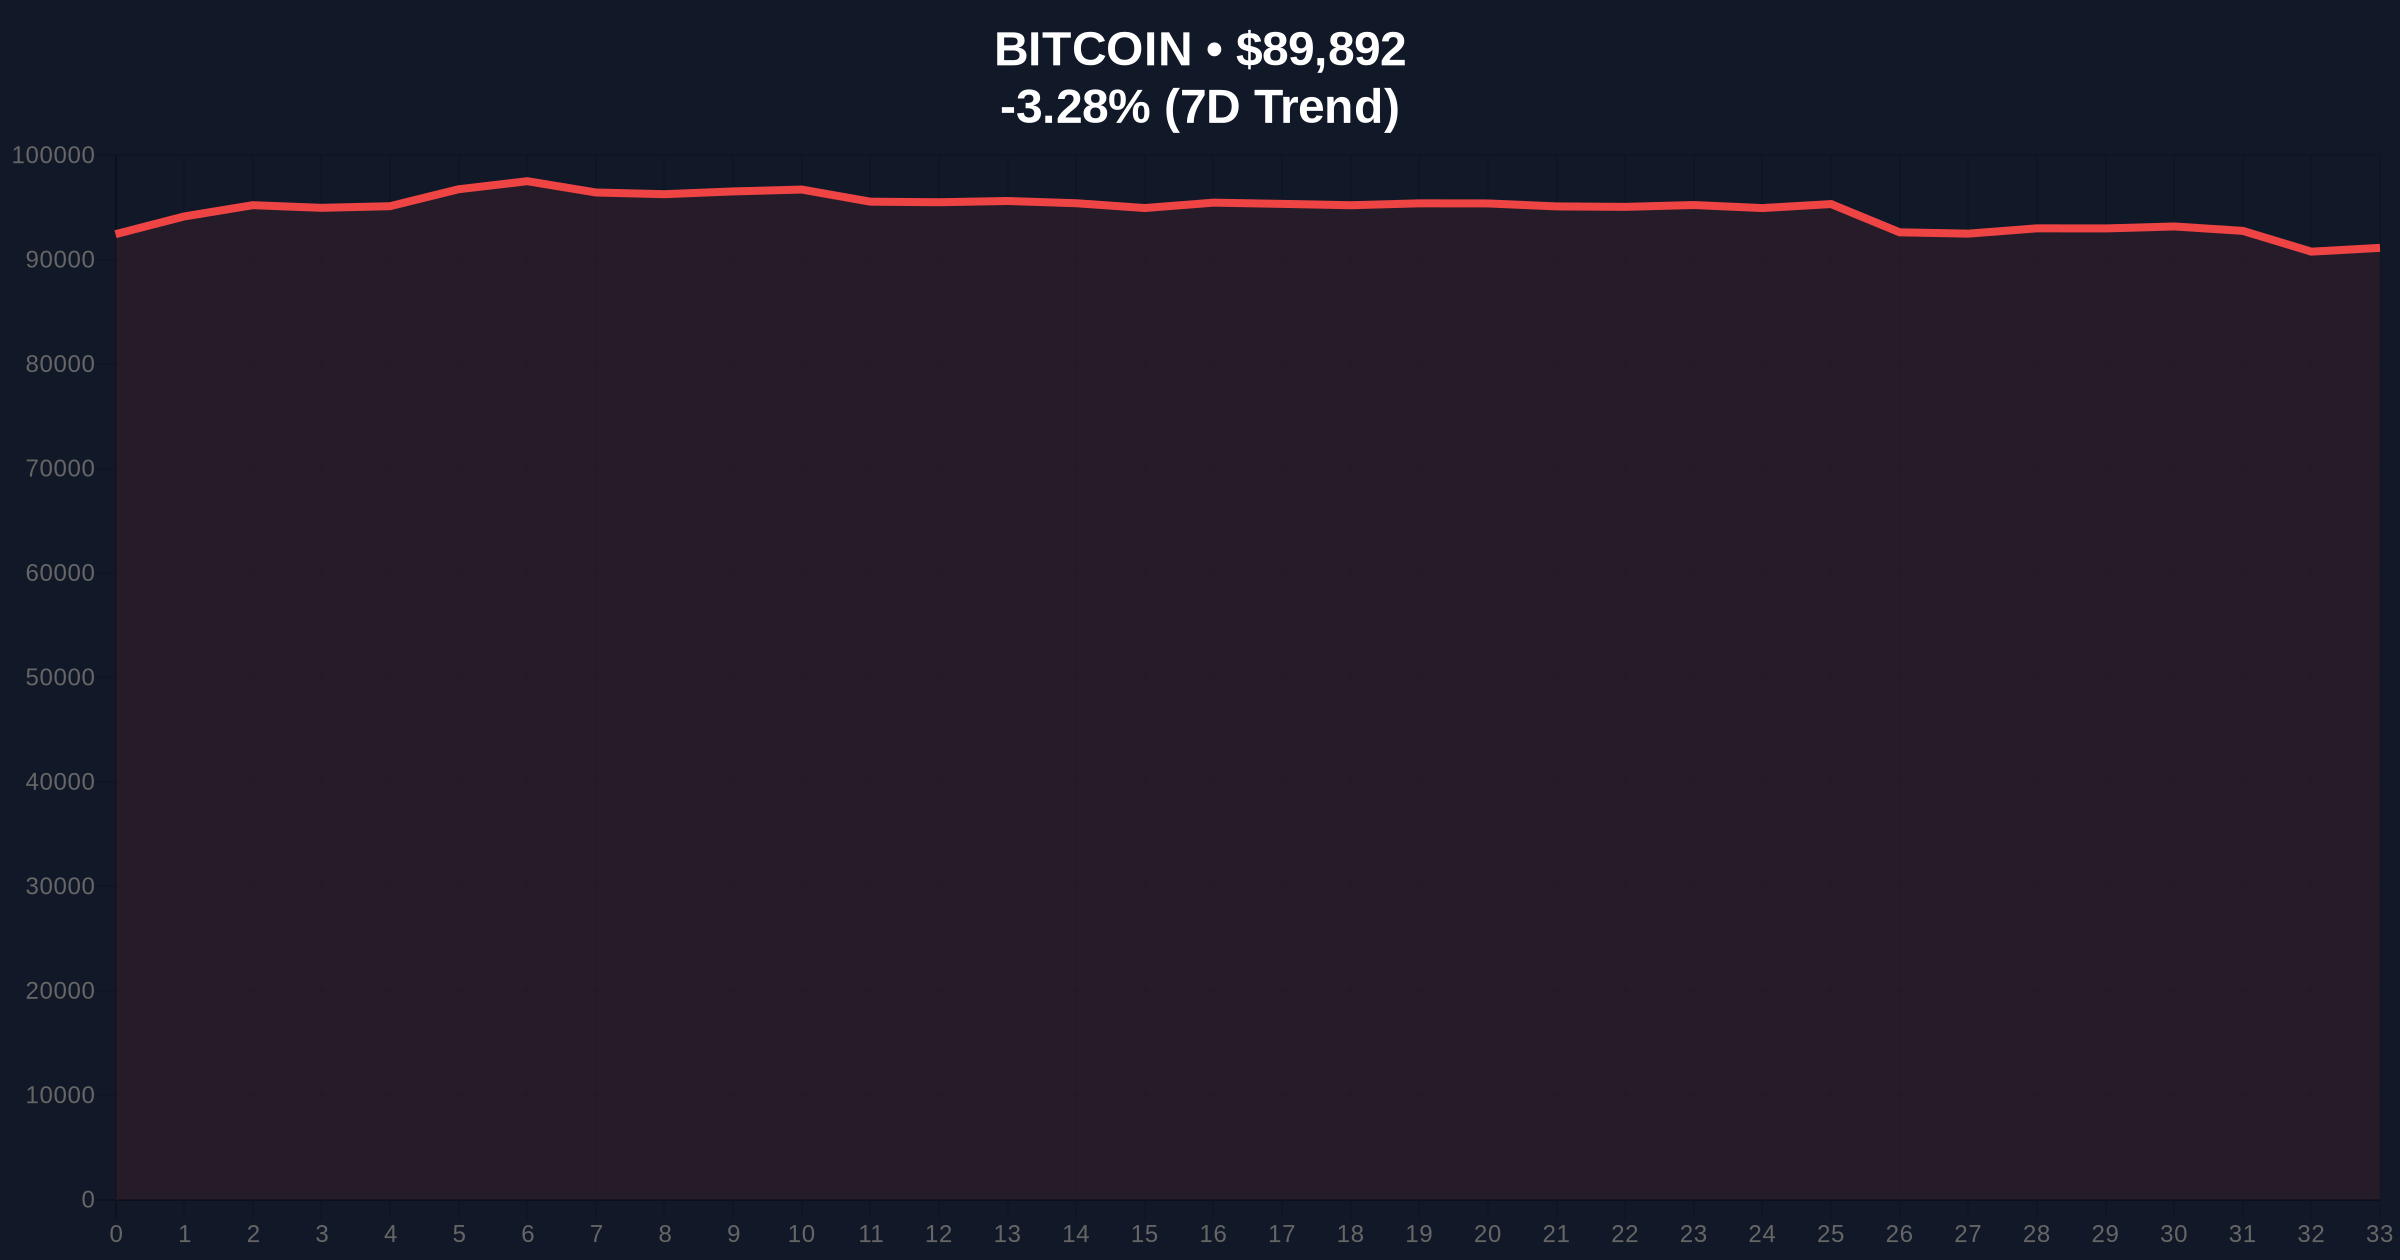
VADODARA, January 20, 2026 — According to CoinNess market monitoring, Bitcoin has broken below the critical $90,000 psychological support level, trading at $89,999 on the Binance USDT market. This Bitcoin price action represents a -3.17% decline in the last 24 hours, occurring alongside a Crypto Fear & Greed Index reading of 32/100, firmly in "Fear" territory. Market structure suggests this move may be testing institutional accumulation zones while creating a potential Fair Value Gap (FVG) below current levels.
Historical cycles indicate that Bitcoin corrections of 15-30% are common during bull market consolidation phases. Similar to the 2021 correction that saw BTC drop from $64,000 to $29,000 before resuming its uptrend, current price action appears to be testing macro support levels. According to on-chain data from Glassnode, the UTXO Realized Price Distribution shows significant accumulation between $85,000 and $90,000, suggesting this zone represents a critical liquidity pool. The current move below $90,000 may be targeting these stop-loss clusters in what quantitative analysts term a "liquidity grab." Related developments include recent large-scale stablecoin movements, such as the $1.25B USDT transfer from Aave to HTX that may be providing market-making liquidity during this volatility.
On January 20, 2026, Bitcoin price action broke below the $90,000 support level that had held for approximately 72 hours. According to CoinNess market monitoring, BTC traded as low as $89,995 on Binance's USDT pairing, representing a -3.17% decline from the previous day's high. Volume profile analysis indicates increased selling pressure during the Asian trading session, with approximately $4.2 billion in spot volume recorded during the breakdown. Market structure suggests this move was preceded by a failed test of the $93,500 resistance level, creating what technical analysts identify as a bearish order block between $92,800 and $93,200.
Technical indicators reveal several critical levels for Bitcoin price action. The 50-day exponential moving average (EMA) at $91,200 has been breached, while the 200-day simple moving average (SMA) provides support at $86,500. Relative Strength Index (RSI) readings show oversold conditions at 28.7 on the 4-hour timeframe, suggesting potential for a short-term bounce. However, the weekly RSI remains neutral at 54.2, indicating this may be a correction within a larger uptrend. Fibonacci retracement levels from the recent $98,500 high to the $82,000 swing low place the 0.618 level at $88,500, which represents the next major support. Bullish invalidation occurs below $88,500, while bearish invalidation requires a reclaim above $92,800 to fill the current Fair Value Gap. Market structure suggests the $90,000 breakdown may be testing the Volume Profile Point of Control (POC) established during the November 2025 accumulation phase.
| Metric | Value | Significance |
|---|---|---|
| Current BTC Price | $89,995 | Below psychological $90,000 support |
| 24-Hour Change | -3.17% | Significant bearish momentum |
| Crypto Fear & Greed Index | 32/100 (Fear) | Capitulation sentiment levels |
| Market Rank | #1 | Maintains dominance despite correction |
| Key Support Level | $88,500 | Fibonacci 0.618 retracement level |
This Bitcoin price action matters because $90,000 represents a critical psychological and technical level that institutional investors monitor for accumulation opportunities. According to Federal Reserve data on monetary policy, current interest rate environments historically correlate with increased crypto volatility as capital rotates between risk assets. For retail traders, the break below $90,000 may trigger margin calls and stop-loss orders, creating what market makers identify as a "gamma squeeze" scenario where volatility accelerates price movements. Institutionally, this price level tests the cost basis of large Bitcoin ETFs approved in 2024, potentially creating buying pressure if the $88,500 support holds. The breakdown also impacts altcoin correlations, with Ethereum showing increased beta volatility during BTC weakness.
Market analysts on X/Twitter express divided views on this Bitcoin price action. Bulls point to historical patterns where breaks below round-number supports like $90,000 often precede strong reversals, citing the "Bart Simpson" pattern observed in 2023. One quantitative trader noted, "The Fair Value Gap created below $92,000 must be filled for bullish structure to resume." Bears highlight increasing exchange reserves reported by Glassnode, suggesting distribution by long-term holders. According to on-chain data, the Spent Output Profit Ratio (SOPR) has dipped below 1.0, indicating realized losses are occurring—a potential capitulation signal that often precedes market bottoms.
Bullish Case: If Bitcoin price action reclaims $92,800 and fills the current Fair Value Gap, the next target becomes the previous all-time high resistance at $98,500. Historical cycles suggest that corrections of this magnitude (approximately 8-10% from recent highs) often resolve upward during bull markets, particularly when the 200-day SMA remains intact. Institutional accumulation between $85,000 and $90,000, as indicated by UTXO age bands, could provide the fuel for a V-shaped recovery. The bullish invalidation level is $88,500—a break below this Fibonacci support would negate the immediate recovery thesis.
Bearish Case: If selling pressure continues and Bitcoin price action breaks the $88,500 support, the next significant level becomes the 200-day SMA at $86,500. A sustained move below this level could trigger a deeper correction toward $82,000, which represents the 0.786 Fibonacci retracement and the previous swing low. Market structure suggests that increased futures funding rates prior to the decline may have created overleveraged positions now being liquidated, potentially exacerbating downside momentum. The bearish invalidation level is $92,800—a reclaim above this order block would suggest the breakdown was a false break or liquidity grab.
Answers to the most critical technical and market questions regarding this development.

Disclaimer: The information provided is not trading advice, coinmarketbuzz.com holds no liability for any investments made based on the information provided on this page. We strongly recommend independent research and/or consultation with a qualified professional before making any investment decisions.
coinmarketbuzz.com leverages advanced AI technology to analyze market data. All content is fact-checked and reviewed by our editorial team to ensure accuracy and neutrality.