Loading News...
Loading...
Loading News...

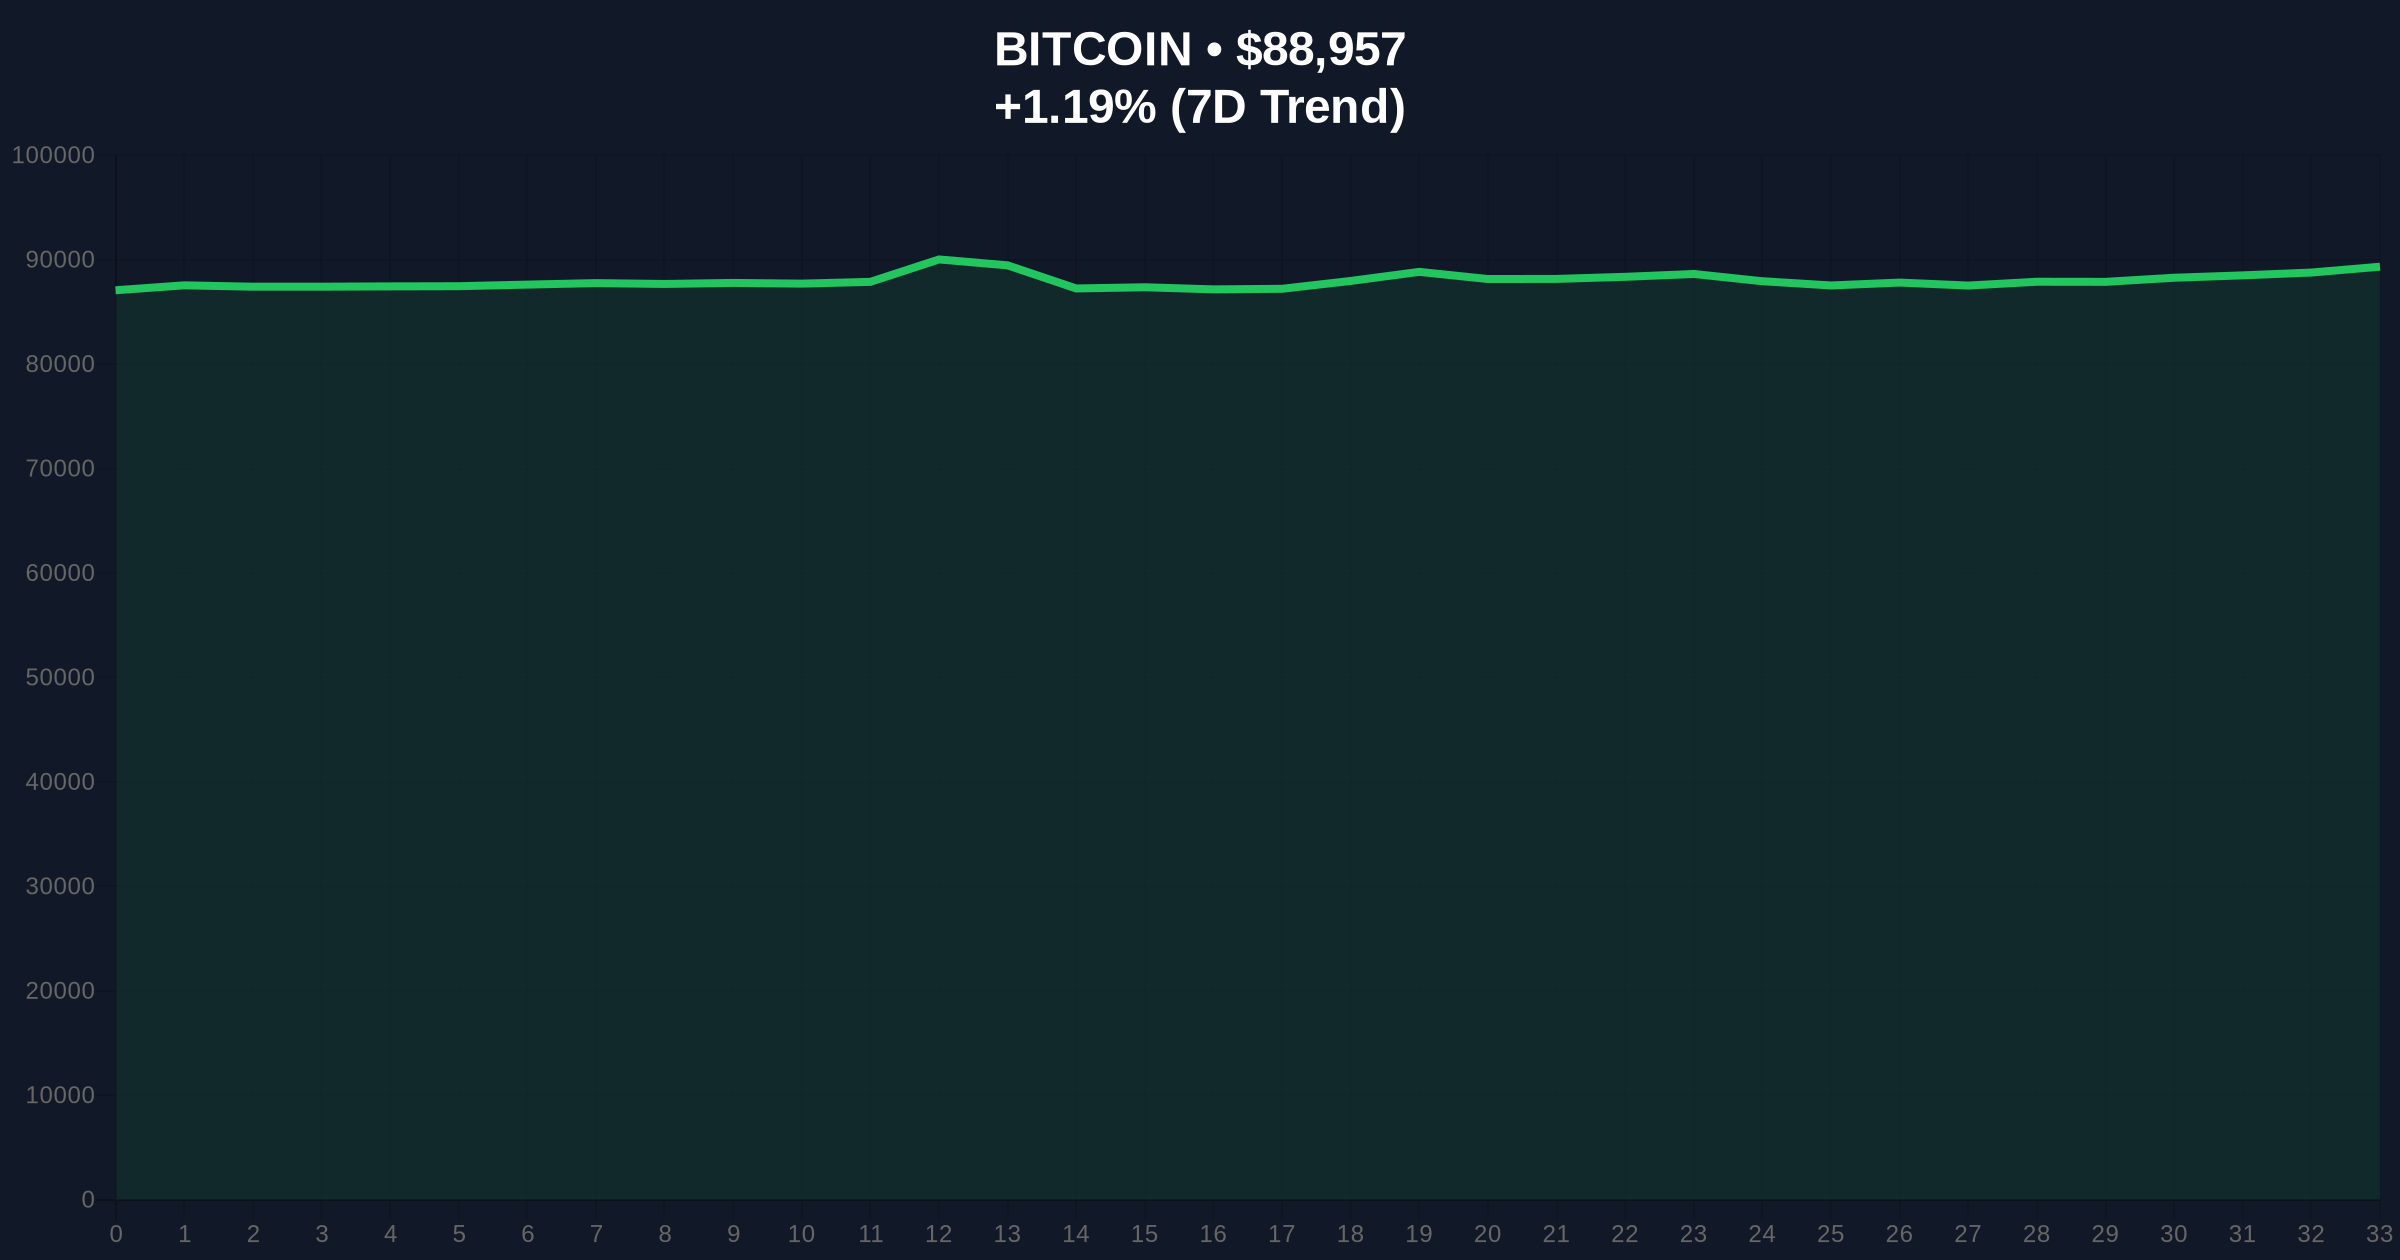
VADODARA, January 2, 2026 — According to CoinNess market monitoring, Bitcoin has broken below the $89,000 psychological threshold, trading at $88,961.21 on the Binance USDT market. This Bitcoin price action represents a critical test of the market structure that has supported BTC's ascent since institutional adoption accelerated in 2024. Market structure suggests this move targets liquidity below recent consolidation ranges, with on-chain data indicating increased selling pressure from short-term holders.
This price movement occurs against a backdrop of extreme market fear, with the Crypto Fear & Greed Index registering 28/100. Historical cycles suggest such sentiment extremes often precede significant directional moves, though the direction remains contested. The current correction mirrors the 2021 post-ATH consolidation pattern where Bitcoin tested multiple support levels before establishing a new equilibrium. Underlying this trend is the maturation of Bitcoin's market microstructure, with institutional participation through spot ETFs creating more defined liquidity pools at key technical levels. Related developments include recent analysis of Bitcoin's break above $90k amid fear market divergence and divergence between US stocks and crypto fear metrics.
On January 2, 2026, Bitcoin's price action saw a decisive break below the $89,000 level, according to CoinNess market monitoring. The asset traded at $88,961.21 on Binance's USDT pairing, representing a 1.27% decline from previous sessions. This movement follows failed attempts to reclaim the $90,000 resistance zone that has capped price action since late December 2025. Market structure suggests this represents a liquidity grab targeting stop-loss orders clustered below round-number psychological levels. The breakdown coincides with increased selling volume on major exchanges, particularly in Asian trading sessions where regulatory uncertainty persists.
Technical analysis reveals several critical levels in this Bitcoin price action. The immediate support zone clusters between $87,500 and $88,000, corresponding to the 50-day exponential moving average and a high-volume node on the volume profile. A Fair Value Gap (FVG) exists between $89,500 and $90,200 from the rapid decline, which market structure suggests will act as resistance on any retracement. The Relative Strength Index (RSI) on daily timeframes sits at 42, indicating neutral momentum with room for further downside. Bullish Invalidation Level: $87,200 (break below the 200-day moving average and weekly order block). Bearish Invalidation Level: $90,500 (reclaim of the FVG and previous consolidation range). The Fibonacci retracement from the recent swing high at $92,800 places the 0.618 level at $87,900, aligning with the volume profile support.
| Metric | Value | Significance |
|---|---|---|
| Current Price | $89,033 | Below key $89k psychological level |
| 24-Hour Change | -1.27% | Moderate selling pressure |
| Crypto Fear & Greed Index | 28/100 (Fear) | Extreme fear sentiment |
| Market Rank | #1 | Maintains dominance position |
| Key Support Level | $87,500-$88,000 | Volume profile cluster & 50-day EMA |
This Bitcoin price action matters because it tests the institutional framework established post-ETF approval. For institutions, a break below $87,200 would invalidate the bullish thesis built on continuous ETF inflows and macro adoption. Retail traders face increased margin call risk at these levels, particularly those leveraging positions entered above $90,000. The divergence between extreme fear sentiment and relatively modest price decline suggests either capitulation is near or a sentiment-driven bounce is developing. According to Ethereum's official documentation on market mechanics, such sentiment extremes often precede volatility expansions regardless of direction.
Market analysts on X/Twitter express divided views. Bulls point to the historical tendency for Bitcoin to bounce from extreme fear readings, citing the 2020 COVID crash and 2022 FTX collapse as precedents. Bears highlight the breakdown of the ascending triangle pattern that had formed since November 2025, suggesting further downside toward the $85,000 region. One quantitative analyst noted, "The order block at $88,200 represents the last defense for the bullish structure—a break here opens the path to $86,000." This sentiment echoes concerns about broader market liquidity, as seen in recent analysis of Bitfarms' $30M liquidity grab for AI infrastructure.
Bullish Case: If Bitcoin holds the $87,500-$88,000 support cluster and the Fear & Greed Index begins reversing from extreme readings, a retracement to fill the FVG at $89,500-$90,200 becomes probable. Sustained buying above $90,500 would invalidate the bearish structure and target the previous local high at $92,800. This scenario requires ETF inflows to resume and macro conditions to stabilize, particularly regarding Federal Reserve policy on interest rates.
Bearish Case: A breakdown below $87,200 would confirm the bearish invalidation level, triggering further selling toward the next significant support at $85,000 (the 0.786 Fibonacci level). This could accelerate if miner selling pressure increases post-halving or if regulatory developments, similar to those highlighted in analysis of Bitfinex hacker early release market volatility, create uncertainty. The bearish target extends to $82,000 where the 200-week moving average and psychological support converge.
Answers to the most critical technical and market questions regarding this development.

Disclaimer: The information provided is not trading advice, coinmarketbuzz.com holds no liability for any investments made based on the information provided on this page. We strongly recommend independent research and/or consultation with a qualified professional before making any investment decisions.
coinmarketbuzz.com leverages advanced AI technology to analyze market data. All content is fact-checked and reviewed by our editorial team to ensure accuracy and neutrality.