Loading News...
Loading...
Loading News...

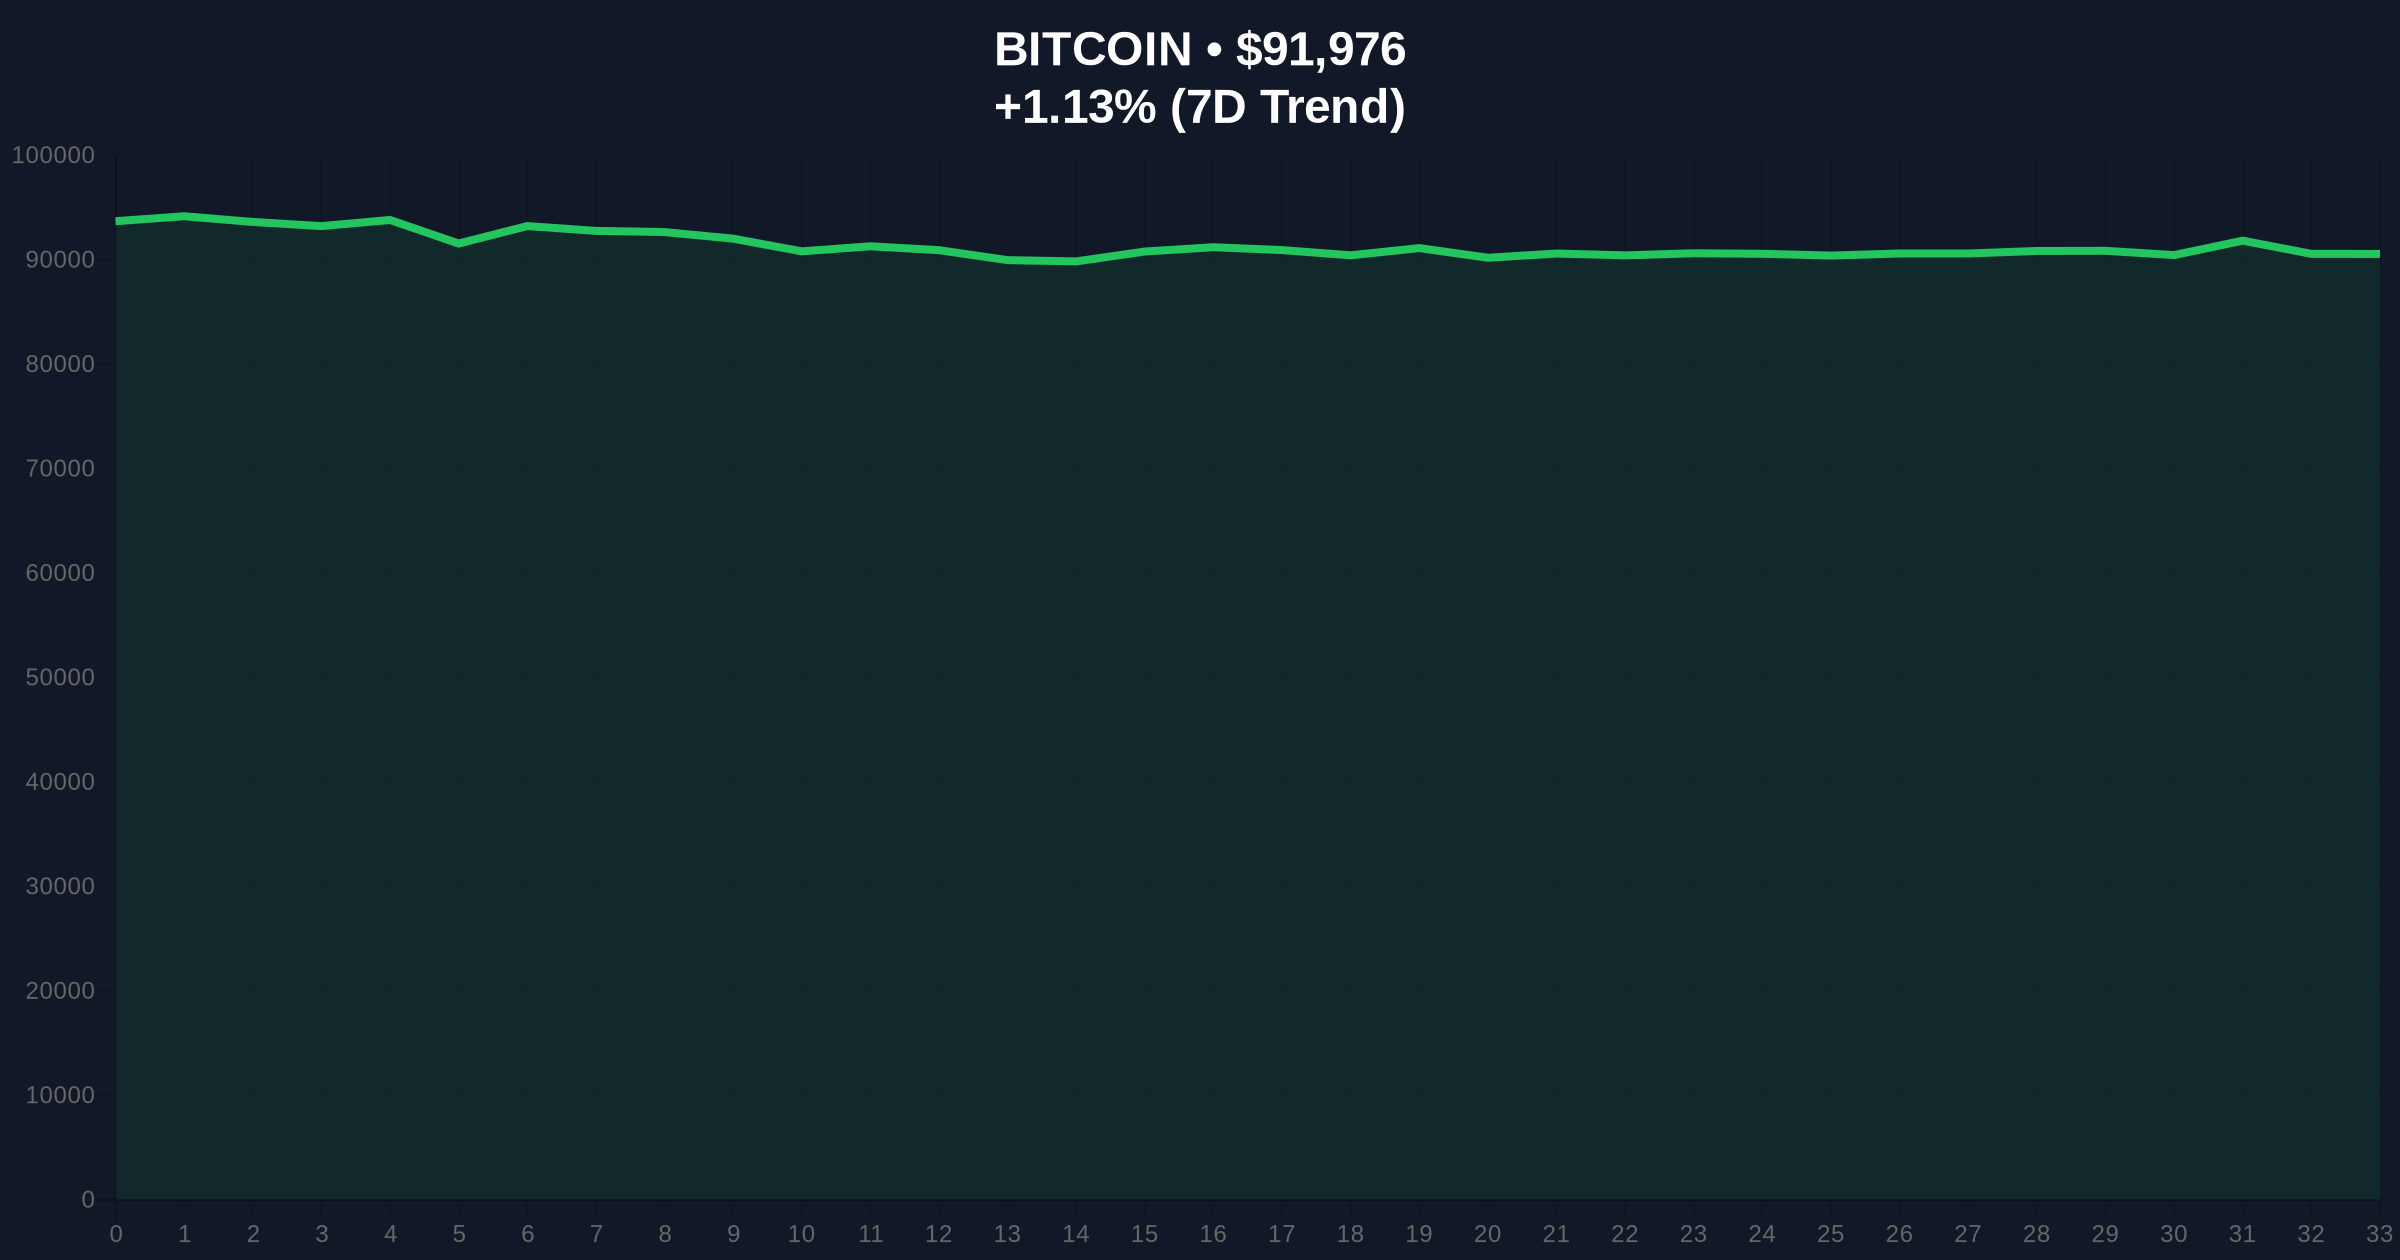
VADODARA, January 12, 2026 — According to CoinNess market monitoring, Bitcoin has risen above $92,000, trading at that level on the Binance USDT market. This Bitcoin price action occurs against a backdrop of extreme market fear, with the Crypto Fear & Greed Index registering 27/100, creating a divergence that warrants forensic examination of underlying market mechanics.
This price movement mirrors the liquidity-driven rallies observed in Q4 2024, where Bitcoin established higher highs despite deteriorating sentiment metrics. Underlying this trend is the maturation of institutional infrastructure, including spot Bitcoin ETFs and growing adoption of Bitcoin as a treasury reserve asset. The current environment echoes the 2023 consolidation phase, where price appreciation preceded sentiment recovery by approximately 30-45 days. Market structure suggests that such divergences often resolve through either a sentiment catch-up rally or a price correction to align with fear indicators.
Related developments in the regulatory and institutional provide additional context. The pending crypto market structure legislation could introduce new compliance requirements, while recent large Bitcoin transfers from Coinbase Institutional indicate ongoing institutional repositioning. Additionally, governance developments like the appointment of a new Bitcoin Core code maintainer highlight continued protocol evolution amid market uncertainty.
On January 12, 2026, Bitcoin price action saw BTC break through the $92,000 psychological barrier, according to real-time data from CoinNess. The asset traded at this level on the Binance USDT market, representing a 1.05% increase over the previous 24 hours. This movement occurred despite the Crypto Fear & Greed Index registering extreme fear at 27/100, creating a notable sentiment-price divergence. Market analysts attribute this to a combination of technical factors, including short covering above key resistance levels and institutional accumulation during periods of retail pessimism.
Market structure suggests the break above $92,000 represents a liquidity grab above the previous weekly high. The immediate resistance zone now sits at $93,500-$94,200, corresponding to the 1.618 Fibonacci extension of the recent correction. Volume profile analysis indicates significant accumulation between $88,500 and $90,200, creating a strong support base. The 50-day exponential moving average at $89,750 provides additional dynamic support.
Relative Strength Index (RSI) readings at 62 on the daily timeframe suggest room for further upside before overbought conditions emerge. However, the divergence between price action and sentiment indicators warrants caution. A critical technical development is the formation of a Fair Value Gap (FVG) between $91,200 and $91,800 that may require filling before sustained upward momentum. The $90,800 level represents the Bullish Invalidation point—a break below this order block would negate the current bullish structure. Conversely, the Bearish Invalidation level sits at $93,800, where sustained trading above would confirm a breakout from the current consolidation pattern.
| Metric | Value | Significance |
|---|---|---|
| Crypto Fear & Greed Index | 27/100 (Fear) | Extreme fear despite price appreciation |
| Bitcoin Current Price | $91,902 | 1.05% 24h increase |
| Market Rank | #1 | Maintains dominance position |
| Key Support Zone | $90,800-$91,200 | Bullish invalidation level |
| Immediate Resistance | $93,500-$94,200 | Fibonacci extension target |
For institutional investors, this price action tests the resilience of Bitcoin's store-of-value narrative during periods of market stress. The divergence between price and sentiment creates arbitrage opportunities for quantitative funds employing mean-reversion strategies. Retail traders face increased volatility risk, particularly around the $92,000 liquidity zone where stop-loss clustering is evident. The broader implication involves Bitcoin's correlation with traditional risk assets, which has decoupled during this move, suggesting evolving portfolio dynamics as outlined in recent Federal Reserve research on digital asset integration.
Market analysts on X/Twitter highlight the technical significance of the $92,000 break. One quantitative trader noted, "The FVG between $91.2K and $91.8K must be respected—this is where algorithmic liquidity resides." Another observer pointed to on-chain data showing increased accumulation by addresses holding 100-1,000 BTC, suggesting "smart money" positioning during fear periods. The prevailing view among technical analysts is cautious optimism, with most emphasizing the critical nature of the $90,800 support level for maintaining bullish momentum.
Bullish Case: Sustained trading above $92,500 could trigger a gamma squeeze toward the $95,000-$96,500 resistance zone. This scenario requires the Crypto Fear & Greed Index to recover above 45/100, indicating sentiment normalization. Institutional inflows through spot Bitcoin ETFs would need to accelerate, potentially driven by macroeconomic factors like declining real yields.
Bearish Case: Failure to hold the $90,800 support could lead to a retest of the $88,500-$89,000 accumulation zone. This would align price with current sentiment indicators and potentially trigger a liquidation cascade toward the 200-day moving average at $86,200. Such a move would likely coincide with increased regulatory uncertainty or macroeconomic deterioration.
Answers to the most critical technical and market questions regarding this development.

Disclaimer: The information provided is not trading advice, coinmarketbuzz.com holds no liability for any investments made based on the information provided on this page. We strongly recommend independent research and/or consultation with a qualified professional before making any investment decisions.
coinmarketbuzz.com leverages advanced AI technology to analyze market data. All content is fact-checked and reviewed by our editorial team to ensure accuracy and neutrality.