Loading News...
Loading...
Loading News...

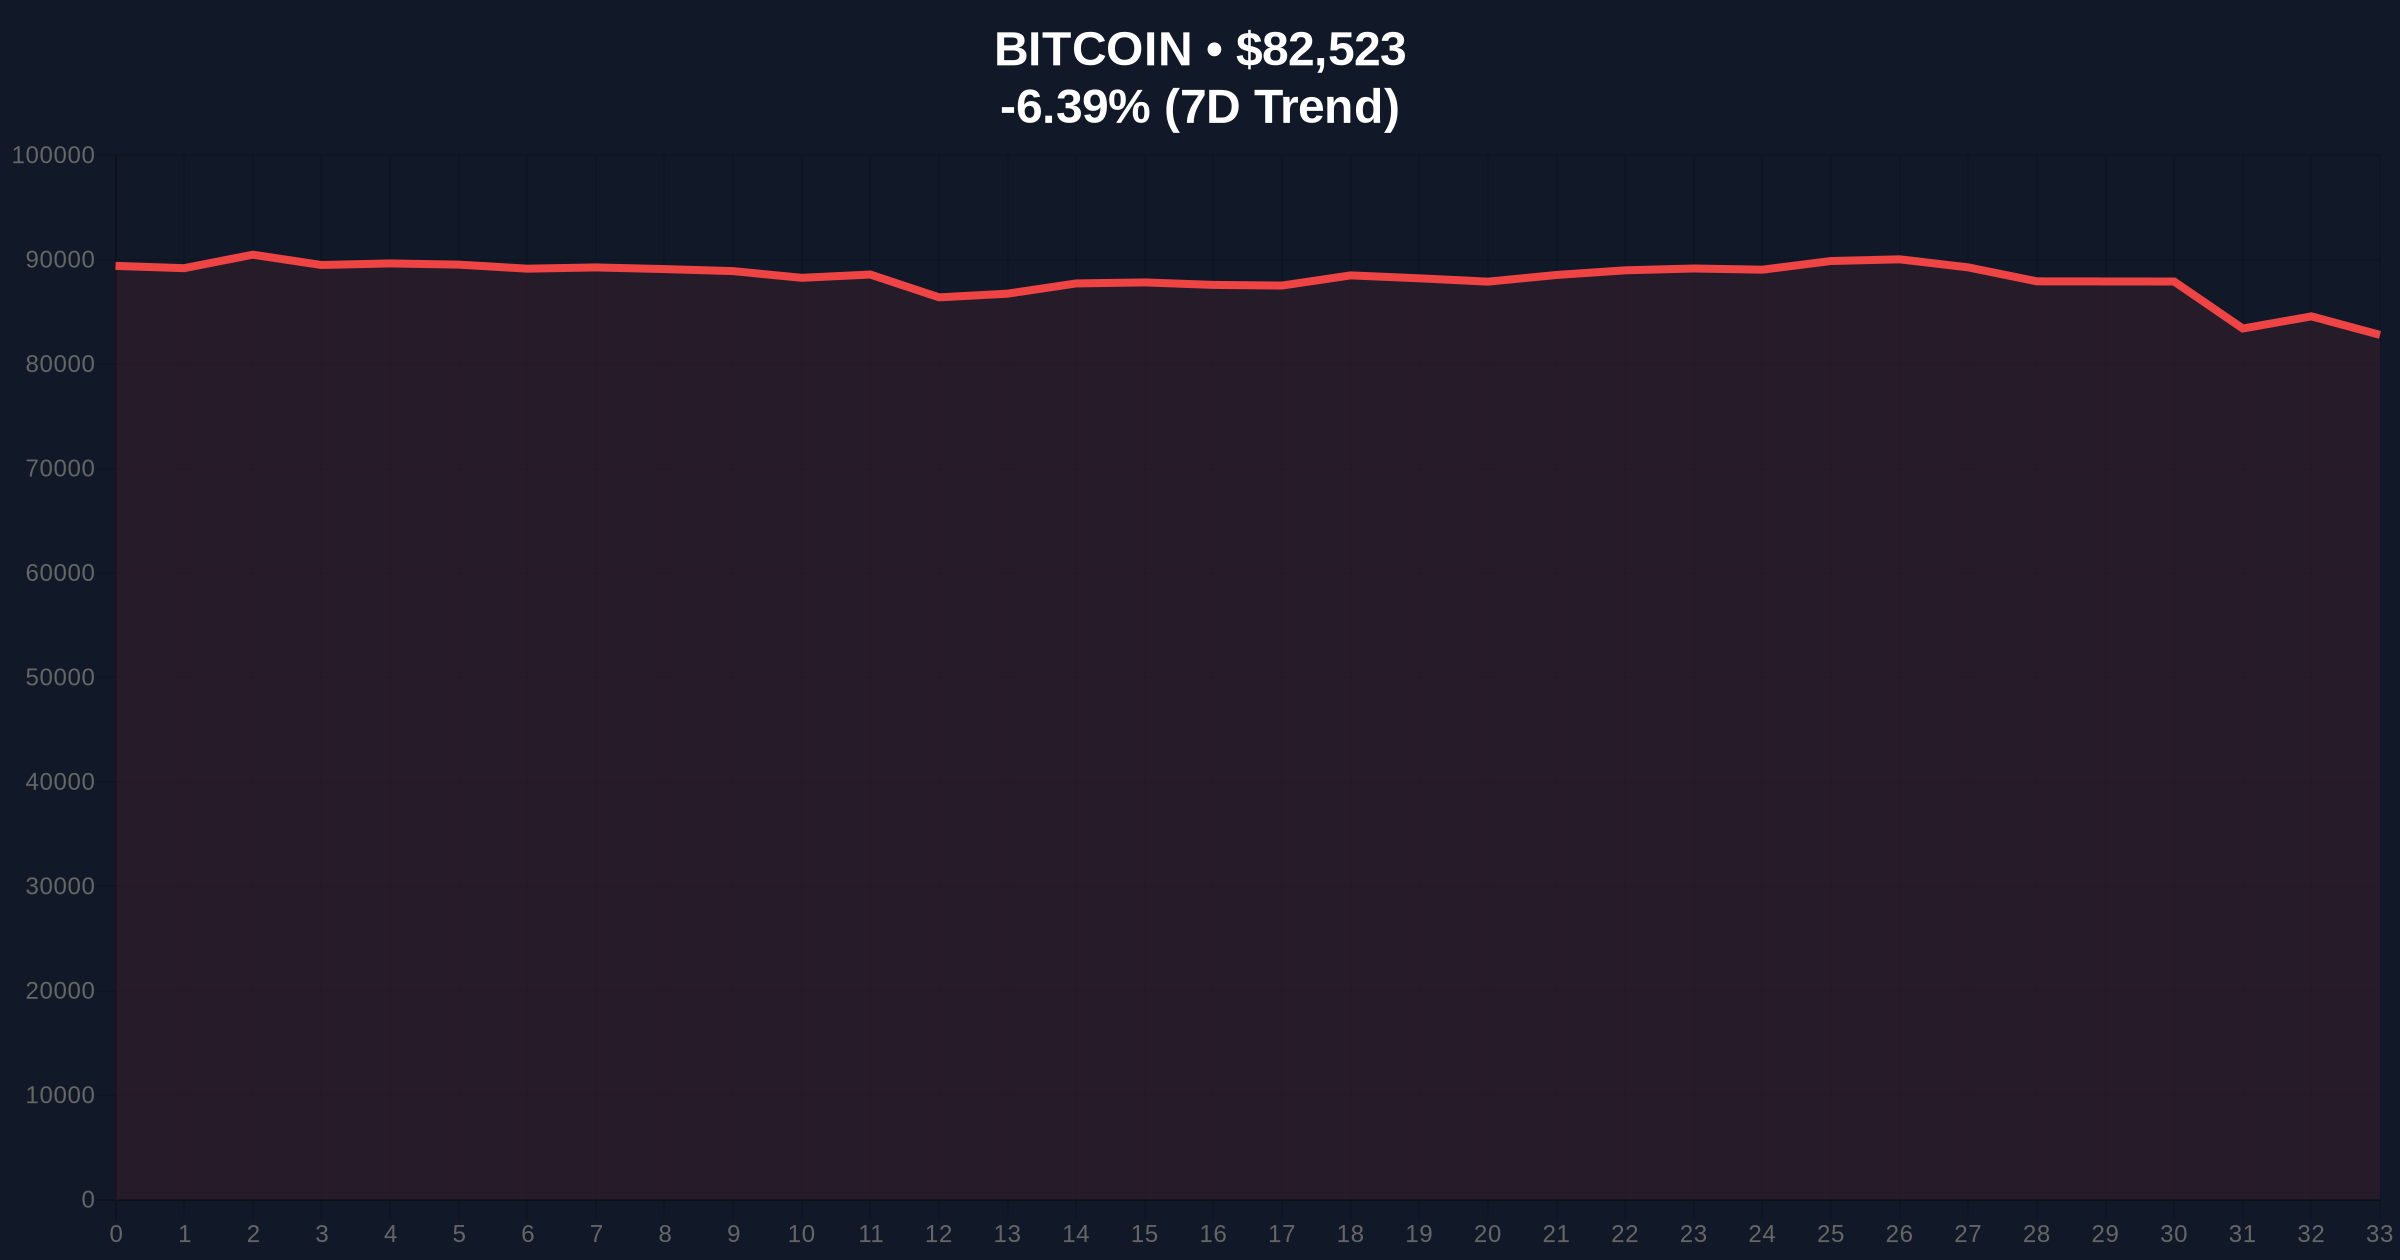
VADODARA, January 30, 2026 — Bitcoin plunged 6.34% to $82,565 in a sharp liquidity-driven sell-off, as BitMEX co-founder Arthur Hayes attributed the drop to a $300 billion contraction in U.S. dollar liquidity. This daily crypto analysis examines the macro forces behind the decline, with on-chain data indicating extreme market fear and technical levels at critical junctures.
Arthur Hayes stated on X that Bitcoin's recent decline is unsurprising amid a contraction in U.S. dollar liquidity. According to his analysis, dollar liquidity has fallen by approximately $300 billion in recent weeks. Concurrently, the U.S. Treasury General Account (TGA) balance increased by about $200 billion. Hayes suggested this shift likely stems from the U.S. government securing cash in preparation for a potential shutdown. Market structure suggests this liquidity grab is pressuring risk assets, including Bitcoin.
Consequently, Bitcoin's price action reflects a classic response to tightening dollar conditions. The TGA surge, as tracked on Treasury.gov, acts as a liquidity sink, reducing available capital for speculative investments. This dynamic creates a Fair Value Gap (FVG) in Bitcoin's chart, where price deviates from intrinsic value based on macro flows.
Historically, Bitcoin has demonstrated high correlation with global dollar liquidity metrics. In contrast to the 2021 bull run fueled by expansive monetary policy, current conditions mirror the 2018 taper tantrum, where liquidity withdrawals triggered a 50% correction. Underlying this trend, the Federal Reserve's balance sheet adjustments often precede crypto volatility spikes.
, related developments show exchanges reacting to extreme fear. For instance, Coinone extended a TWT investment warning, while Upbit delisted GoChain (GO) amid regulatory scrutiny. These actions underscore a broader risk-off sentiment permeating the crypto ecosystem.
Bitcoin's price action reveals critical technical levels. The current drop breached the 50-day moving average at $85,000, signaling bearish momentum. A key Fibonacci retracement level at $80,000 (0.618 of the recent rally) now acts as major support. Volume profile analysis shows increased selling pressure near $84,000, forming a resistance Order Block.
, the Relative Strength Index (RSI) dipped to 35, approaching oversold territory. This suggests potential for a short-term bounce if macro conditions stabilize. However, on-chain metrics like UTXO age bands indicate long-term holders are distributing, adding to sell-side pressure. Market structure suggests a break below $80,000 could trigger a cascade toward $75,000.
| Metric | Value | Implication |
|---|---|---|
| Bitcoin Current Price | $82,565 | Down 6.34% in 24h |
| Crypto Fear & Greed Index | 16/100 (Extreme Fear) | Historically a contrarian buy signal |
| Dollar Liquidity Contraction | $300 billion | Primary macro driver per Hayes |
| TGA Balance Increase | $200 billion | Liquidity sink per Treasury data |
| Key Fibonacci Support | $80,000 | Critical level for trend validation |
This liquidity contraction matters because it directly impacts Bitcoin's valuation as a global risk asset. Institutional liquidity cycles dictate capital flows into and out of crypto. A shrinking dollar pool reduces available leverage for futures and perpetual swaps, potentially triggering liquidations. Retail market structure often amplifies these moves through panic selling.
Additionally, the TGA surge reflects fiscal policy shifts that could precede broader economic tightening. According to on-chain data from Glassnode, exchange outflows have slowed, indicating reduced buying interest. This creates a supply-demand imbalance favoring bears in the short term.
"Market structure suggests Bitcoin is acting as a liquidity barometer. The $300 billion dollar contraction and TGA increase represent a classic risk-off signal. Historically, such macro shifts have led to prolonged consolidation phases in crypto," said the CoinMarketBuzz Intelligence Desk.
Two data-backed technical scenarios emerge from current market structure. First, a bullish reversal requires reclaiming the $85,000 resistance and stabilizing above the 50-day MA. Second, a bearish continuation targets the $80,000 Fibonacci support.
The 12-month institutional outlook hinges on dollar liquidity trends. If the TGA balance normalizes and liquidity expands, Bitcoin could resume its uptrend toward $100,000. Conversely, sustained contraction may lead to a prolonged bear market, aligning with past cycles like 2018. This analysis connects to a 5-year horizon where Bitcoin's correlation with macro liquidity remains a key valuation driver.

Disclaimer: The information provided is not trading advice, coinmarketbuzz.com holds no liability for any investments made based on the information provided on this page. We strongly recommend independent research and/or consultation with a qualified professional before making any investment decisions.
coinmarketbuzz.com leverages advanced AI technology to analyze market data. All content is fact-checked and reviewed by our editorial team to ensure accuracy and neutrality.