Loading News...
Loading...
Loading News...

VADODARA, January 20, 2026 — The latest crypto news reveals Bitcoin's Hash Ribbons indicator has flashed a buy signal while the cryptocurrency defends the critical $90,000 support level, creating a technical divergence that warrants quantitative examination. According to on-chain data from Glassnode, this signal emerged during the recovery phase following miner capitulation, a pattern that has historically preceded significant bull market advances.
Market structure suggests Bitcoin is navigating a complex macro environment where traditional financial pressures intersect with blockchain-specific metrics. The Hash Ribbons indicator, which analyzes 30-day and 60-day moving averages of Bitcoin's hash rate, serves as a sophisticated miner sentiment gauge. Historical cycles indicate that when the 30-day hash rate moving average crosses above the 60-day average following a period of miner capitulation, it typically signals the end of mining distress and the beginning of accumulation phases. This pattern last appeared in July 2025, preceding a 25% rally in BTC price. Underlying this trend is the fundamental relationship between mining economics and network security, where recovering hash rate suggests improved miner profitability and reduced selling pressure from this cohort.
Related developments in the current market environment include increased macro pressure from rising Treasury yields and accelerating corporate Bitcoin accumulation reaching 1.91 million BTC reserves.
According to Cointelegraph, crypto data analyst OnChainMind identified the Hash Ribbons buy signal during Bitcoin's recovery from recent miner capitulation. The signal specifically appeared when the 30-day hash rate moving average crossed above the 60-day average, indicating that mining operations have stabilized following a period of distress. This technical event occurred against a backdrop where Bitcoin's price has been testing the psychologically significant $90,000 level, with some analysts emphasizing that defending this support is for any sustained uptrend. The timing is particularly noteworthy given the current Fear & Greed Index reading of 32/100, suggesting retail sentiment remains cautious despite the bullish on-chain signal.
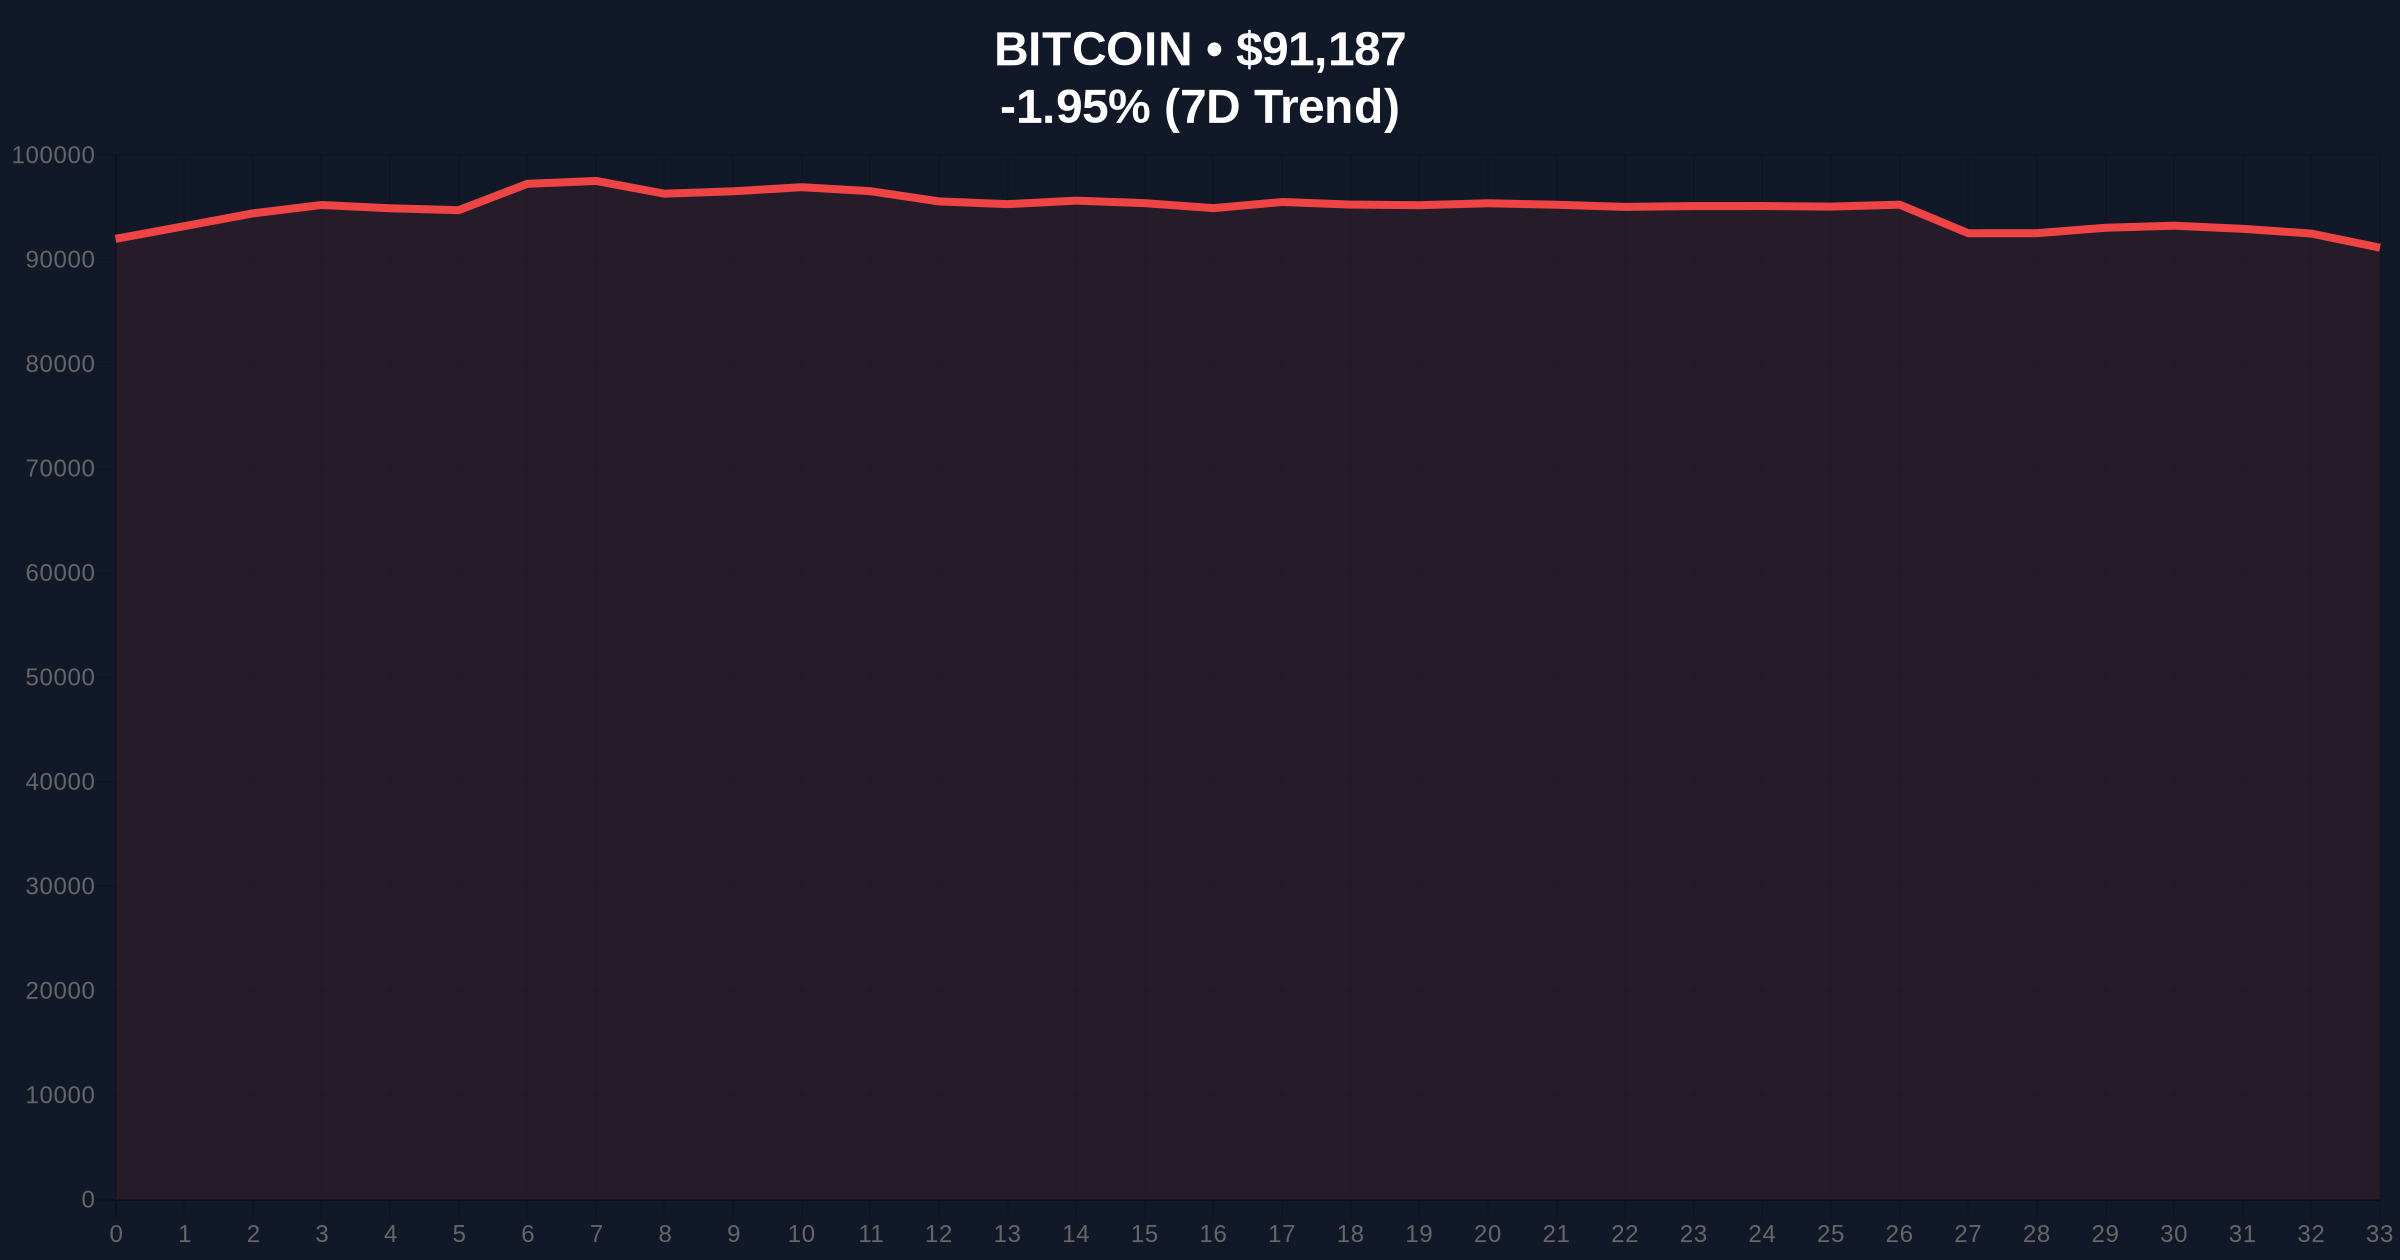
On-chain data indicates Bitcoin is currently trading at $91,166, representing a -1.97% decline over the past 24 hours. The critical support confluence exists at the $90,000 psychological level, which aligns with the 200-day exponential moving average and represents a major volume profile node. Market structure suggests that a sustained break below this level would invalidate the bullish Hash Ribbons signal and potentially trigger a liquidity grab toward the next significant order block around $86,500. Conversely, a successful defense of $90,000 support could create a fair value gap (FVG) targeting the $95,000 resistance zone where substantial sell-side liquidity resides.
The Relative Strength Index (RSI) currently sits at 48, indicating neutral momentum with room for movement in either direction. The 50-day and 200-day moving averages are converging, suggesting potential volatility compression ahead of a directional resolution. Historical analysis of previous Hash Ribbons signals reveals an average gain of 45% over the subsequent 90-day period when accompanied by strong volume confirmation.
| Metric | Value | Significance |
|---|---|---|
| Current Bitcoin Price | $91,166 | Testing critical support confluence |
| 24-Hour Price Change | -1.97% | Minor correction within consolidation range |
| Crypto Fear & Greed Index | 32/100 (Fear) | Divergence from bullish on-chain signal |
| Hash Ribbons Signal Date | January 2026 | First buy signal since July 2025 |
| Previous Signal Performance | +25% rally | Historical precedent for current setup |
This development matters because it represents a fundamental divergence between on-chain miner behavior and short-term price action. For institutional investors, the Hash Ribbons signal provides quantitative evidence of improving network fundamentals despite price volatility. The recovery from miner capitulation suggests reduced selling pressure from this historically influential cohort, potentially creating a more favorable supply-demand balance. For retail participants, the signal offers a data-driven framework for assessing market cycles beyond emotional reactions to price fluctuations.
The critical intersection occurs at the $90,000 support level, which serves as both a technical and psychological threshold. A successful defense here would validate the Hash Ribbons signal and potentially trigger algorithmic buying from quantitative funds that monitor these metrics. Conversely, failure at this level would represent a significant bearish invalidation, suggesting that miner recovery alone cannot overcome broader market headwinds.
Market analysts on social platforms are divided regarding the signal's implications. Bulls point to the historical accuracy of Hash Ribbons in identifying accumulation phases, particularly when combined with other on-chain metrics like UTXO age bands and exchange outflow volumes. Bears emphasize the macro headwinds, including potential regulatory developments and traditional market correlations. The consensus among quantitative analysts suggests that while the signal is statistically significant, it requires price confirmation above $92,500 to trigger broader institutional participation.
Bullish Case: If Bitcoin successfully defends the $90,000 support level and achieves a weekly close above $92,500, the Hash Ribbons signal suggests potential upside toward the $105,000 resistance zone. This scenario would be confirmed by increasing network activity metrics and sustained hash rate growth. The bullish invalidation level sits at $89,200, representing the recent swing low that must hold to maintain the positive structure.
Bearish Case: If Bitcoin breaks below the $90,000 support with conviction, particularly on elevated volume, the Hash Ribbons signal would be invalidated, potentially triggering a liquidity grab toward the $86,500 order block. This scenario would likely coincide with continued fear sentiment and increased correlation with traditional risk assets. The bearish invalidation level is $93,800, where a break above would negate the immediate downside pressure.
Answers to the most critical technical and market questions regarding this development.

Disclaimer: The information provided is not trading advice, coinmarketbuzz.com holds no liability for any investments made based on the information provided on this page. We strongly recommend independent research and/or consultation with a qualified professional before making any investment decisions.
coinmarketbuzz.com leverages advanced AI technology to analyze market data. All content is fact-checked and reviewed by our editorial team to ensure accuracy and neutrality.