Loading News...
Loading...
Loading News...

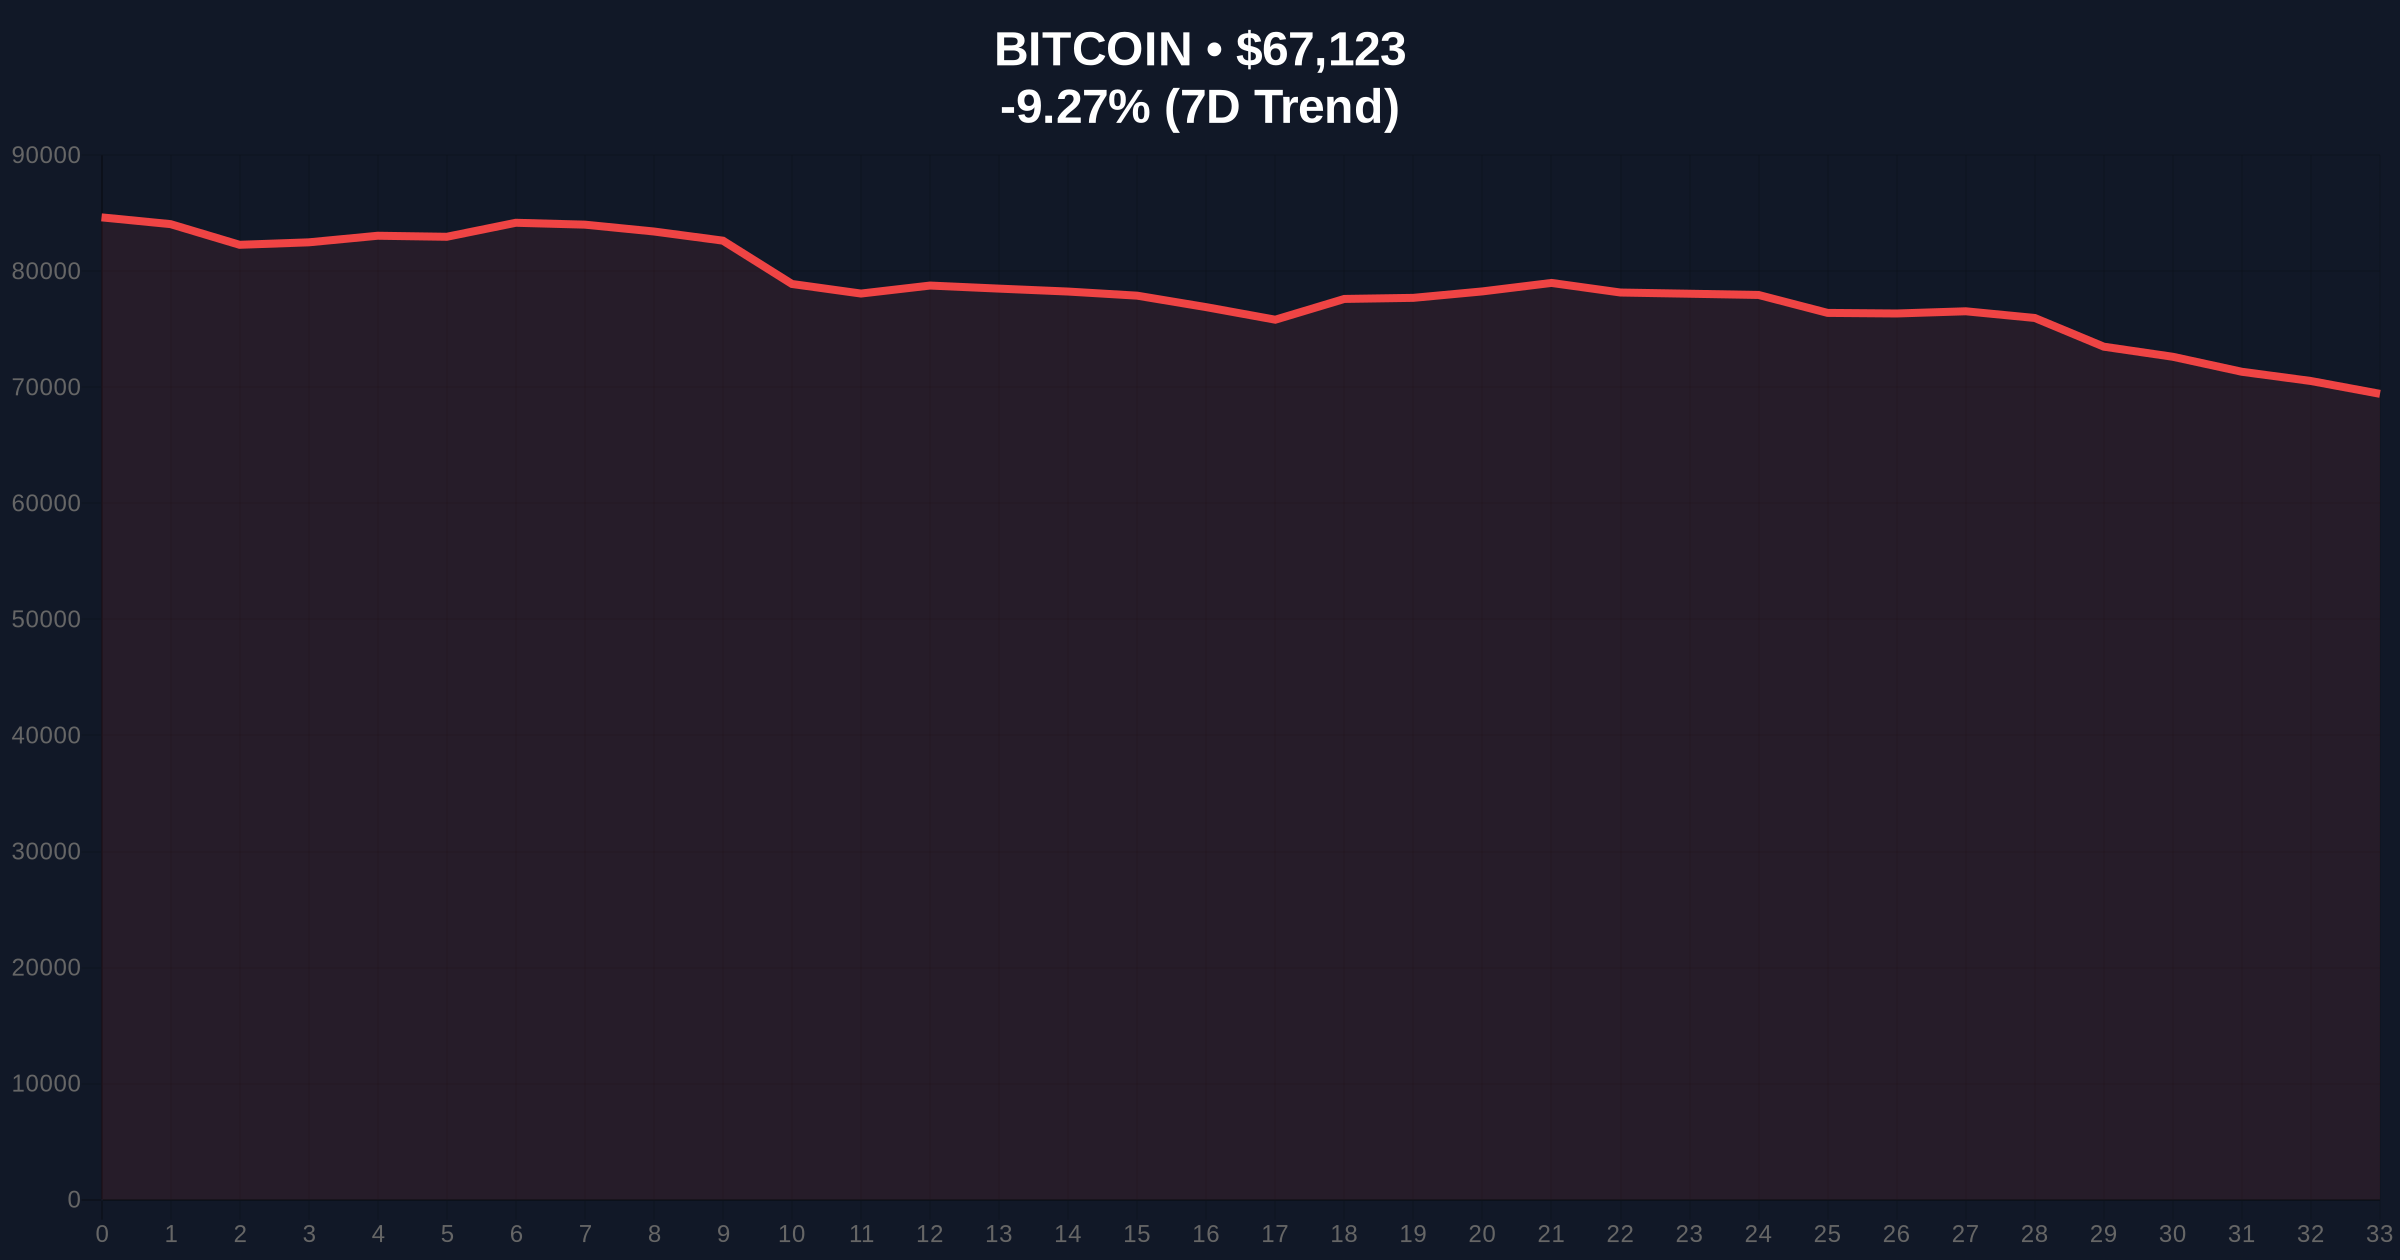
VADODARA, February 5, 2026 — Bitcoin plunged below the critical $70,000 psychological threshold today, trading at $67,100 with a 9.30% daily decline. According to on-chain data from Glassnode, this move triggered significant liquidations across derivatives markets. Industry experts compiled by CoinDesk argue that short-term price action remains irrelevant amid broader structural shifts toward code-based systems.
CoinDesk's compilation reveals starkly optimistic long-term views despite current price weakness. Balaji Srinivasan, former CTO of Coinbase, stated he has never been more optimistic about cryptocurrency. He believes a rules-based order is collapsing while a code-based order emerges. Srinivasan argued that short-term prices are unimportant because nations will fail and be replaced by networks. This necessitates cryptocurrency for what he calls internet capitalism, democracy, and privacy.
Samson Mow, CEO of Jan3, commented that the current downturn feels terrible not due to scale but perceived unfairness. He noted crypto stagnates while other assets rise, falling amid AI bubble concerns and gold price drops. However, Mow emphasized absolute scarcity as a clear reality. Prices cannot fall forever according to his analysis. Market structure suggests these statements attempt to anchor long-term narratives despite immediate technical breakdowns.
Historically, Bitcoin has experienced similar corrections during bull markets. The 2021 cycle saw multiple 20-30% drawdowns before reaching new highs. In contrast, current sentiment metrics show Extreme Fear at 12/100, matching December 2022 lows. This creates a potential contrarian signal. Underlying this trend, institutional adoption continues through vehicles like spot Bitcoin ETFs, though recent liquidations suggest leveraged positions are unwinding.
Related developments include massive futures liquidations exceeding $473 million and exchange withdrawals indicating liquidity stress. These events compound the current price action, creating what technical analysts call a liquidity grab below key support levels.
Market structure suggests Bitcoin broke below the $70,000 support cluster that previously acted as a major order block. The current price of $67,100 now tests the Fibonacci 0.618 retracement level from the recent swing high. This level at approximately $65,000 represents critical support. A breakdown would create a significant Fair Value Gap (FVG) needing filling.
Relative Strength Index (RSI) on daily charts shows oversold conditions below 30. This often precedes short-term bounces. However, volume profile analysis indicates weak buying interest at current levels. The 50-day moving average at $72,500 now acts as resistance. Technical architecture reveals that without reclaiming this level, the bearish structure remains intact.
| Metric | Value | Significance |
|---|---|---|
| Current Bitcoin Price | $67,100 | Below key $70K psychological support |
| 24-Hour Change | -9.30% | Significant daily drawdown |
| Crypto Fear & Greed Index | 12/100 (Extreme Fear) | Contrarian bullish signal historically |
| Fibonacci 0.618 Support | $65,000 | Critical technical level |
| 50-Day Moving Average | $72,500 | Immediate resistance zone |
This price action matters because it tests institutional conviction. According to Ethereum.org's documentation on blockchain fundamentals, network security relies on economic incentives. Sharp price declines can impact miner revenue and network security. , the disconnect between expert narrative and price reality reveals potential market manipulation. Bulls argue this is healthy consolidation before next leg up.
Bears point to weakening technical structure and liquidations. Retail sentiment shows Extreme Fear, often a precursor to capitulation. Institutional flows through ETFs will determine next directional move. Market structure suggests we are at an inflection point where either accumulation or distribution occurs.
"The current price action represents noise against the signal of structural adoption. While technicals show breakdown, on-chain data indicates long-term holders continue accumulating. The real story isn't the $70,000 break but whether the $65,000 Fibonacci level holds as institutional support." — CoinMarketBuzz Intelligence Desk
Two data-backed scenarios emerge from current market structure. The bullish scenario requires reclaiming $72,500 to invalidate the breakdown. The bearish scenario involves breaking $65,000 and testing the 200-day moving average near $60,000. Historical cycles suggest such corrections typically resolve within 4-6 weeks before resuming trend.
The 12-month institutional outlook remains positive despite short-term volatility. Structural shifts toward digital assets continue according to Federal Reserve research on digital currency adoption. However, immediate price action will determine whether this correction represents buying opportunity or warning sign.

Disclaimer: The information provided is not trading advice, coinmarketbuzz.com holds no liability for any investments made based on the information provided on this page. We strongly recommend independent research and/or consultation with a qualified professional before making any investment decisions.
coinmarketbuzz.com leverages advanced AI technology to analyze market data. All content is fact-checked and reviewed by our editorial team to ensure accuracy and neutrality.