Loading News...
Loading...
Loading News...

VADODARA, January 15, 2026 — U.S. spot Ethereum ETFs recorded $175.03 million in net inflows on Jan. 14, marking the third consecutive day of positive flows, according to data from TraderT. This daily crypto analysis reveals a critical contradiction: while institutional products attract capital, Ethereum's price action exhibits bearish divergence, suggesting a potential Fair Value Gap (FVG) that may resolve downward. Market structure suggests this inflow streak could be a liquidity grab ahead of a larger correction, as on-chain data indicates weakening retail participation despite ETF enthusiasm.
This inflow pattern mirrors the early 2025 Bitcoin ETF adoption phase, where sustained capital inflows initially failed to prevent a 15% correction due to overleveraged positions. According to Ethereum.org documentation on network upgrades, the impending Pectra hardfork introduces technical uncertainty, potentially dampening short-term price momentum despite institutional interest. Historical cycles suggest that three-day inflow streaks often precede volatility spikes, as seen in Q4 2024 when similar ETF activity led to a gamma squeeze that trapped bullish sentiment. The current environment is further complicated by macroeconomic headwinds, including potential Federal Reserve policy shifts that could impact risk assets.
On January 14, 2026, TraderT data confirmed zero net outflows across all U.S. spot Ethereum ETFs, with BlackRock's ETHA leading at $81.65 million in inflows. Grayscale's ETH and ETHE funds followed with $43.47 million and $32.35 million, respectively. Other notable inflows included Bitwise's ETHW at $7.97 million, Fidelity's FETH at $5.89 million, and VanEck's ETHV at $3.70 million. This distribution indicates concentrated capital in established issuers, raising questions about market breadth and sustainability. The absence of outflows contrasts with typical profit-taking behavior, hinting at strategic accumulation rather than speculative trading.
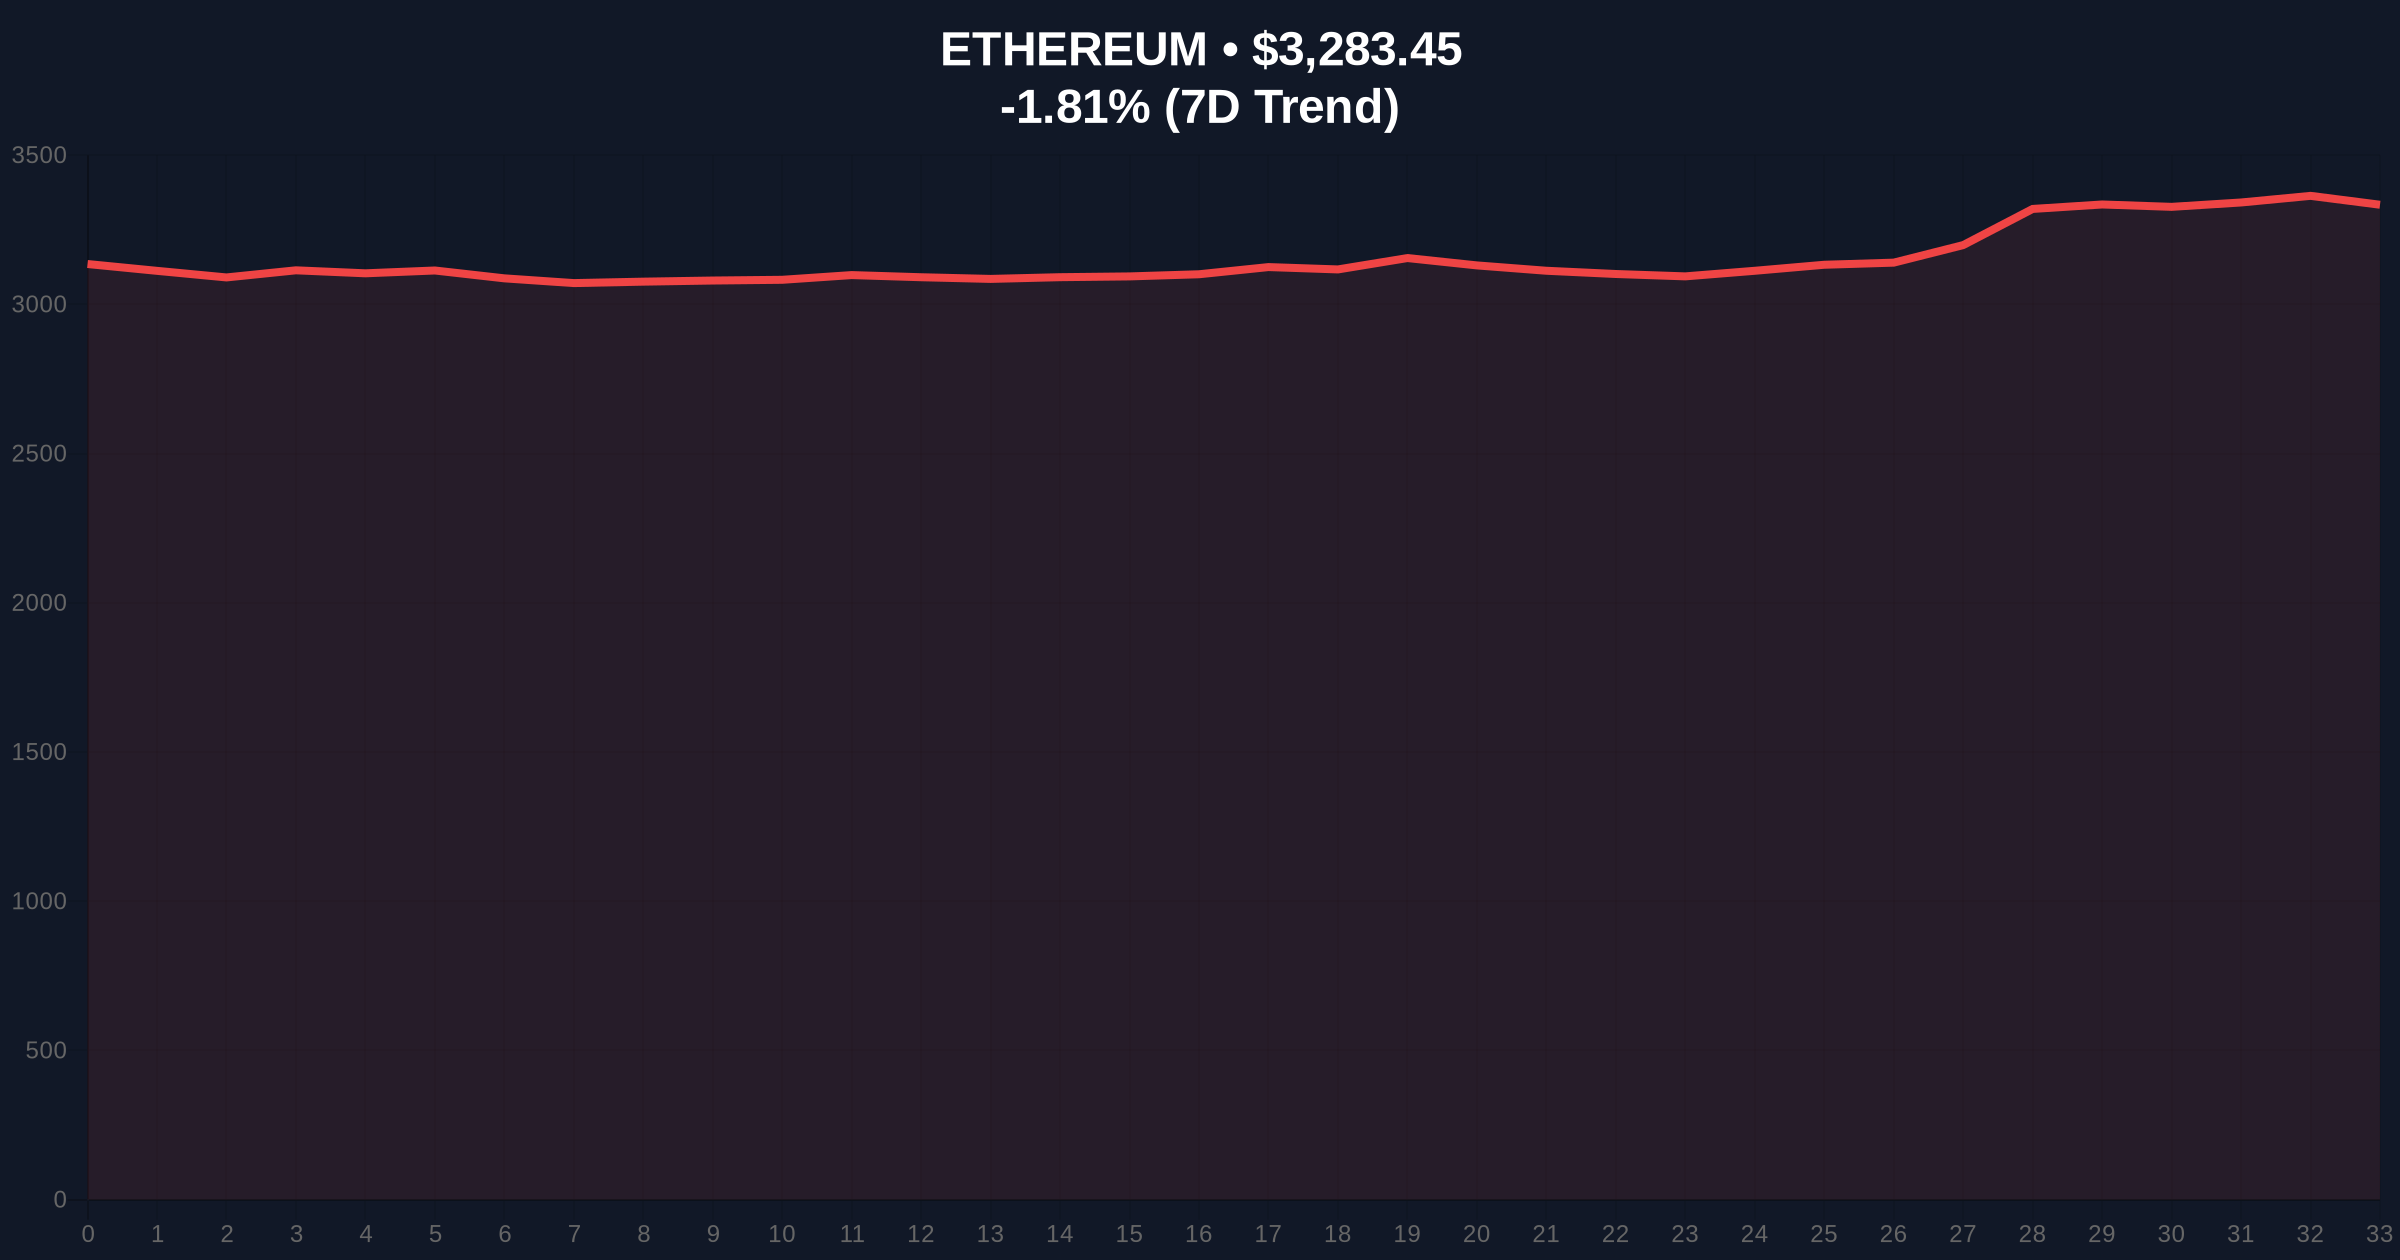
Ethereum's current price of $3,283.24 represents a -1.81% 24-hour decline, creating a bearish divergence against rising ETF inflows. The daily chart shows a clear order block between $3,150 and $3,200, which must hold to maintain bullish structure. Resistance is firm at the $3,400 level, aligning with the 0.618 Fibonacci retracement from the 2025 high. RSI readings above 60 suggest overbought conditions, while volume profile analysis indicates thinning liquidity above $3,300. Bullish Invalidation is set at $3,150, where a break would confirm a failed breakout and target lower support. Bearish Invalidation rests at $3,400, a breach of which could trigger a short squeeze toward $3,600.
| Metric | Value | Implication |
|---|---|---|
| Total ETF Inflows (Jan. 14) | $175.03M | Institutional accumulation |
| Ethereum Current Price | $3,283.24 | Bearish divergence present |
| 24-Hour Price Change | -1.81% | Negative momentum |
| Crypto Fear & Greed Index | 61 (Greed) | Overbought sentiment risk |
| Market Rank | #2 | Dominance under pressure |
For institutions, these inflows reinforce Ethereum's status as a core holding, but the disconnect with price action suggests underlying weakness in spot market demand. Retail traders face heightened risk of a liquidity grab, where ETF optimism masks deteriorating technicals. The sustained inflows could pressure derivatives markets, potentially leading to a gamma squeeze if volatility spikes. According to the FederalReserve.gov historical data on interest rates, rising yields may divert capital from crypto, making these inflows a critical buffer against broader outflows. This dynamic the importance of monitoring on-chain metrics like exchange balances and active addresses for confirmation.
Market analysts on X/Twitter highlight the inflow streak but caution against complacency. One quant noted, "ETF flows are bullish, but price is telling a different story—watch for a breakdown below $3,150." Bulls point to BlackRock's dominance as a sign of long-term conviction, while bears emphasize the RSI divergence and low volume as red flags. The overall sentiment is cautiously optimistic, with most expecting a test of the $3,400 resistance before a decisive move.
Bullish Case: If ETF inflows continue and the $3,150 support holds, Ethereum could challenge $3,400 resistance. A breakout above this level, supported by increasing volume, may target $3,600 as the next order block. This scenario requires sustained institutional buying and positive developments from the Pectra upgrade.
Bearish Case: If price breaks below $3,150, it would invalidate the bullish structure and likely trigger a sell-off toward $3,000 support. This could be exacerbated by a broader market correction or negative regulatory news, with the Fair Value Gap between $3,200 and $3,300 acting as a magnet for price.
Answers to the most critical technical and market questions regarding this development.

Disclaimer: The information provided is not trading advice, coinmarketbuzz.com holds no liability for any investments made based on the information provided on this page. We strongly recommend independent research and/or consultation with a qualified professional before making any investment decisions.
coinmarketbuzz.com leverages advanced AI technology to analyze market data. All content is fact-checked and reviewed by our editorial team to ensure accuracy and neutrality.