Loading News...
Loading...
Loading News...

VADODARA, February 10, 2026 — Ethereum's MVRV-Z score has plunged to -0.42, approaching historical bottom ranges according to on-chain data from crypto analytics firm Alphractal. This latest crypto news highlights a critical valuation metric that compares market cap to realized cap, suggesting ETH is undervalued amid current market conditions. The score indicates Ethereum has entered a capitulation phase, similar to previous major bottom formations in 2018 and 2022.
According to Cointelegraph, multiple analysts cite the MVRV-Z score drop as a signal of potential market bottom. The metric, which gauges whether an asset is over or undervalued, shows Ethereum trading below its realized value. Alphractal's analysis confirms the current score places ETH in a bottoming range, though not yet at the absolute lows of -0.76 seen in December 2018. Market structure suggests this aligns with typical accumulation phases during extreme fear periods.
Trader Michaël van de Poppe noted the valuation mirrors previous major bottom phases, making it a time to consider buying. On-chain forensic data from Glassnode liquidity maps indicates reduced selling pressure from long-term holders. This reduction often precedes trend reversals. The current price action reflects a liquidity grab below key psychological levels.
Historically, MVRV-Z scores below zero have marked accumulation zones. The 2018 bear market saw the score hit -0.76, while 2022's bottom registered around -0.5. In contrast, the current -0.42 suggests Ethereum is undervalued but not at extreme historical lows. Underlying this trend is a broader market fear, with the Crypto Fear & Greed Index at 9/100 (Extreme Fear).
Similar to the 2021 correction, institutional inflows have shown resilience despite retail capitulation. For instance, Ethereum ETFs recently saw $57 million in inflows, reversing short-term outflow trends. , spot Bitcoin ETFs recorded $144.9 million inflows amid similar fear, indicating TradFi entry points. These developments mirror past cycles where smart money accumulated during fear phases.
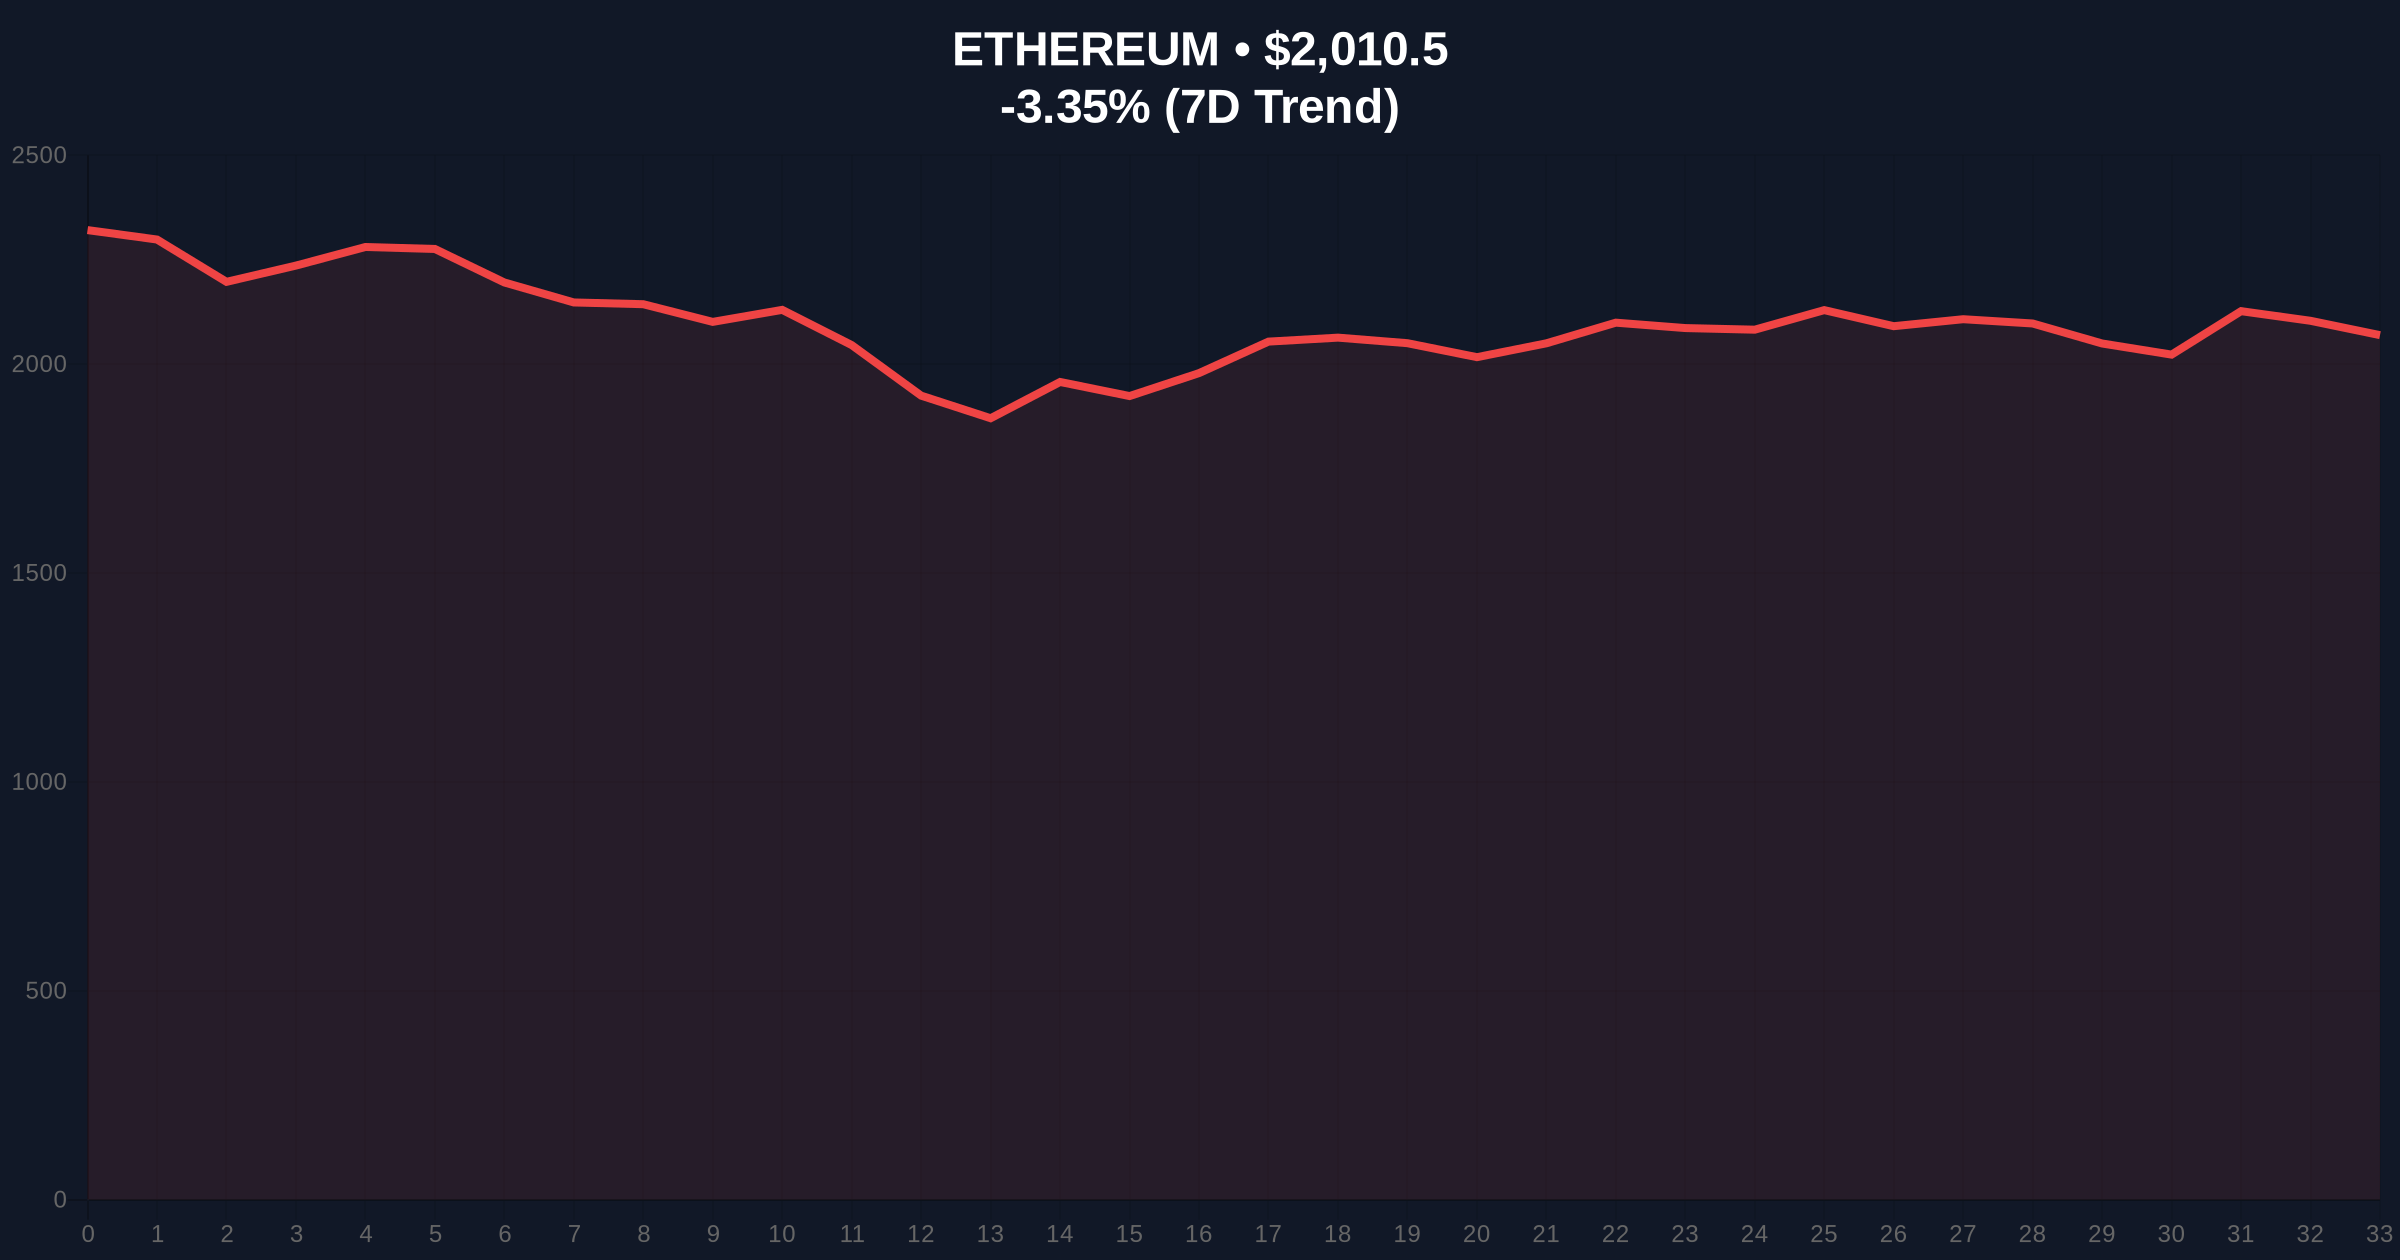
Ethereum currently trades at $2,008.59, down 3.44% in 24 hours. Technical analysis reveals a critical Fair Value Gap (FVG) between $2,100 and $2,150 that must be filled for bullish continuation. The daily RSI sits at 38, indicating oversold conditions but not extreme capitulation. A key Order Block forms near the $1,950 Fibonacci 0.618 support level, derived from the 2024-2025 rally.
Market structure suggests the $1,950 level acts as a volume profile point of control. A break below this invalidation level would signal deeper correction. Conversely, reclaiming the $2,200 resistance could trigger a short squeeze. The current price action reflects post-merge issuance dynamics, with reduced sell pressure from validators compared to previous proof-of-work eras. According to Ethereum's official documentation, the shift to proof-of-stake has altered supply-side economics, impacting long-term valuation models.
| Metric | Value | Implication |
|---|---|---|
| MVRV-Z Score | -0.42 | Undervalued, near bottom range |
| Current ETH Price | $2,008.59 | Down 3.44% in 24h |
| Fear & Greed Index | 9/100 (Extreme Fear) | Capitulation phase likely |
| Historical Low (Dec 2018) | -0.76 | Current score not at extreme |
| Market Rank | #2 | Maintains dominance vs. altcoins |
This data matters for the 5-year horizon because MVRV-Z bottoms often precede multi-year rallies. Institutional liquidity cycles show accumulation during fear phases, as seen with recent ETF inflows. Retail market structure currently exhibits panic selling, creating a divergence from smart money behavior. On-chain data indicates reduced exchange balances, suggesting holders are moving to cold storage.
Real-world evidence includes the decoupling of price from network activity. Ethereum's daily active addresses remain stable despite price declines. This stability often signals underlying strength. The current scenario mirrors 2020's bottom, where undervaluation led to a 1500% rally over 18 months. Market analysts highlight the importance of monitoring UTXO age bands for early reversal signals.
"The MVRV-Z score at -0.42 places Ethereum in a historic buying zone. Similar to Q4 2022, this metric has preceded major rallies. However, traders should watch the $1,950 Fibonacci support for invalidation. The extreme fear reading suggests maximum pain, which often coincides with bottoms." — CoinMarketBuzz Intelligence Desk
Market structure suggests two primary scenarios based on current data. First, a bullish reversal if ETH holds above $1,950 and fills the FVG at $2,150. Second, a bearish extension if support breaks, targeting the 0.786 Fibonacci level at $1,800. The 12-month institutional outlook remains positive due to ETF adoption and EIP-4844 scalability improvements.
Historical cycles suggest that after MVRV-Z bottoms, Ethereum has delivered an average 400% return over 24 months. The current macro environment, with potential Fed rate cuts in 2026, could amplify this effect. Institutional interest, as shown in recent TradFi entry trends, supports long-term accumulation.

Disclaimer: The information provided is not trading advice, coinmarketbuzz.com holds no liability for any investments made based on the information provided on this page. We strongly recommend independent research and/or consultation with a qualified professional before making any investment decisions.
coinmarketbuzz.com leverages advanced AI technology to analyze market data. All content is fact-checked and reviewed by our editorial team to ensure accuracy and neutrality.