Loading News...
Loading...
Loading News...

On March 3, 2026, a breaking analysis from CoinNess, citing a report by Cointelegraph, warned that Ethereum (ETH) could retest its February low if the $1,800 support level fails. The report highlights that a strong support base has formed around this price, with approximately 1.23 million ETH purchased at an average of $1,890 over the past 30 days, according to a Cost Basis Heatmap. Crypto analyst Maartunn added that $130 million in volume has accumulated in the $1,800 range, and technically, this zone coincides with the lower trendline of a symmetrical triangle pattern on the ETH/USD daily chart. If bearish trends persist, ETH could fall to its February 6 low of $1,750 and potentially extend to $1,400. This warning emerges as Ethereum trades at $1,950.83, with a 24-hour trend of 0.83%, and global crypto sentiment registers as "Extreme Fear" with a score of 14/100, indicating heightened market anxiety and potential volatility ahead.
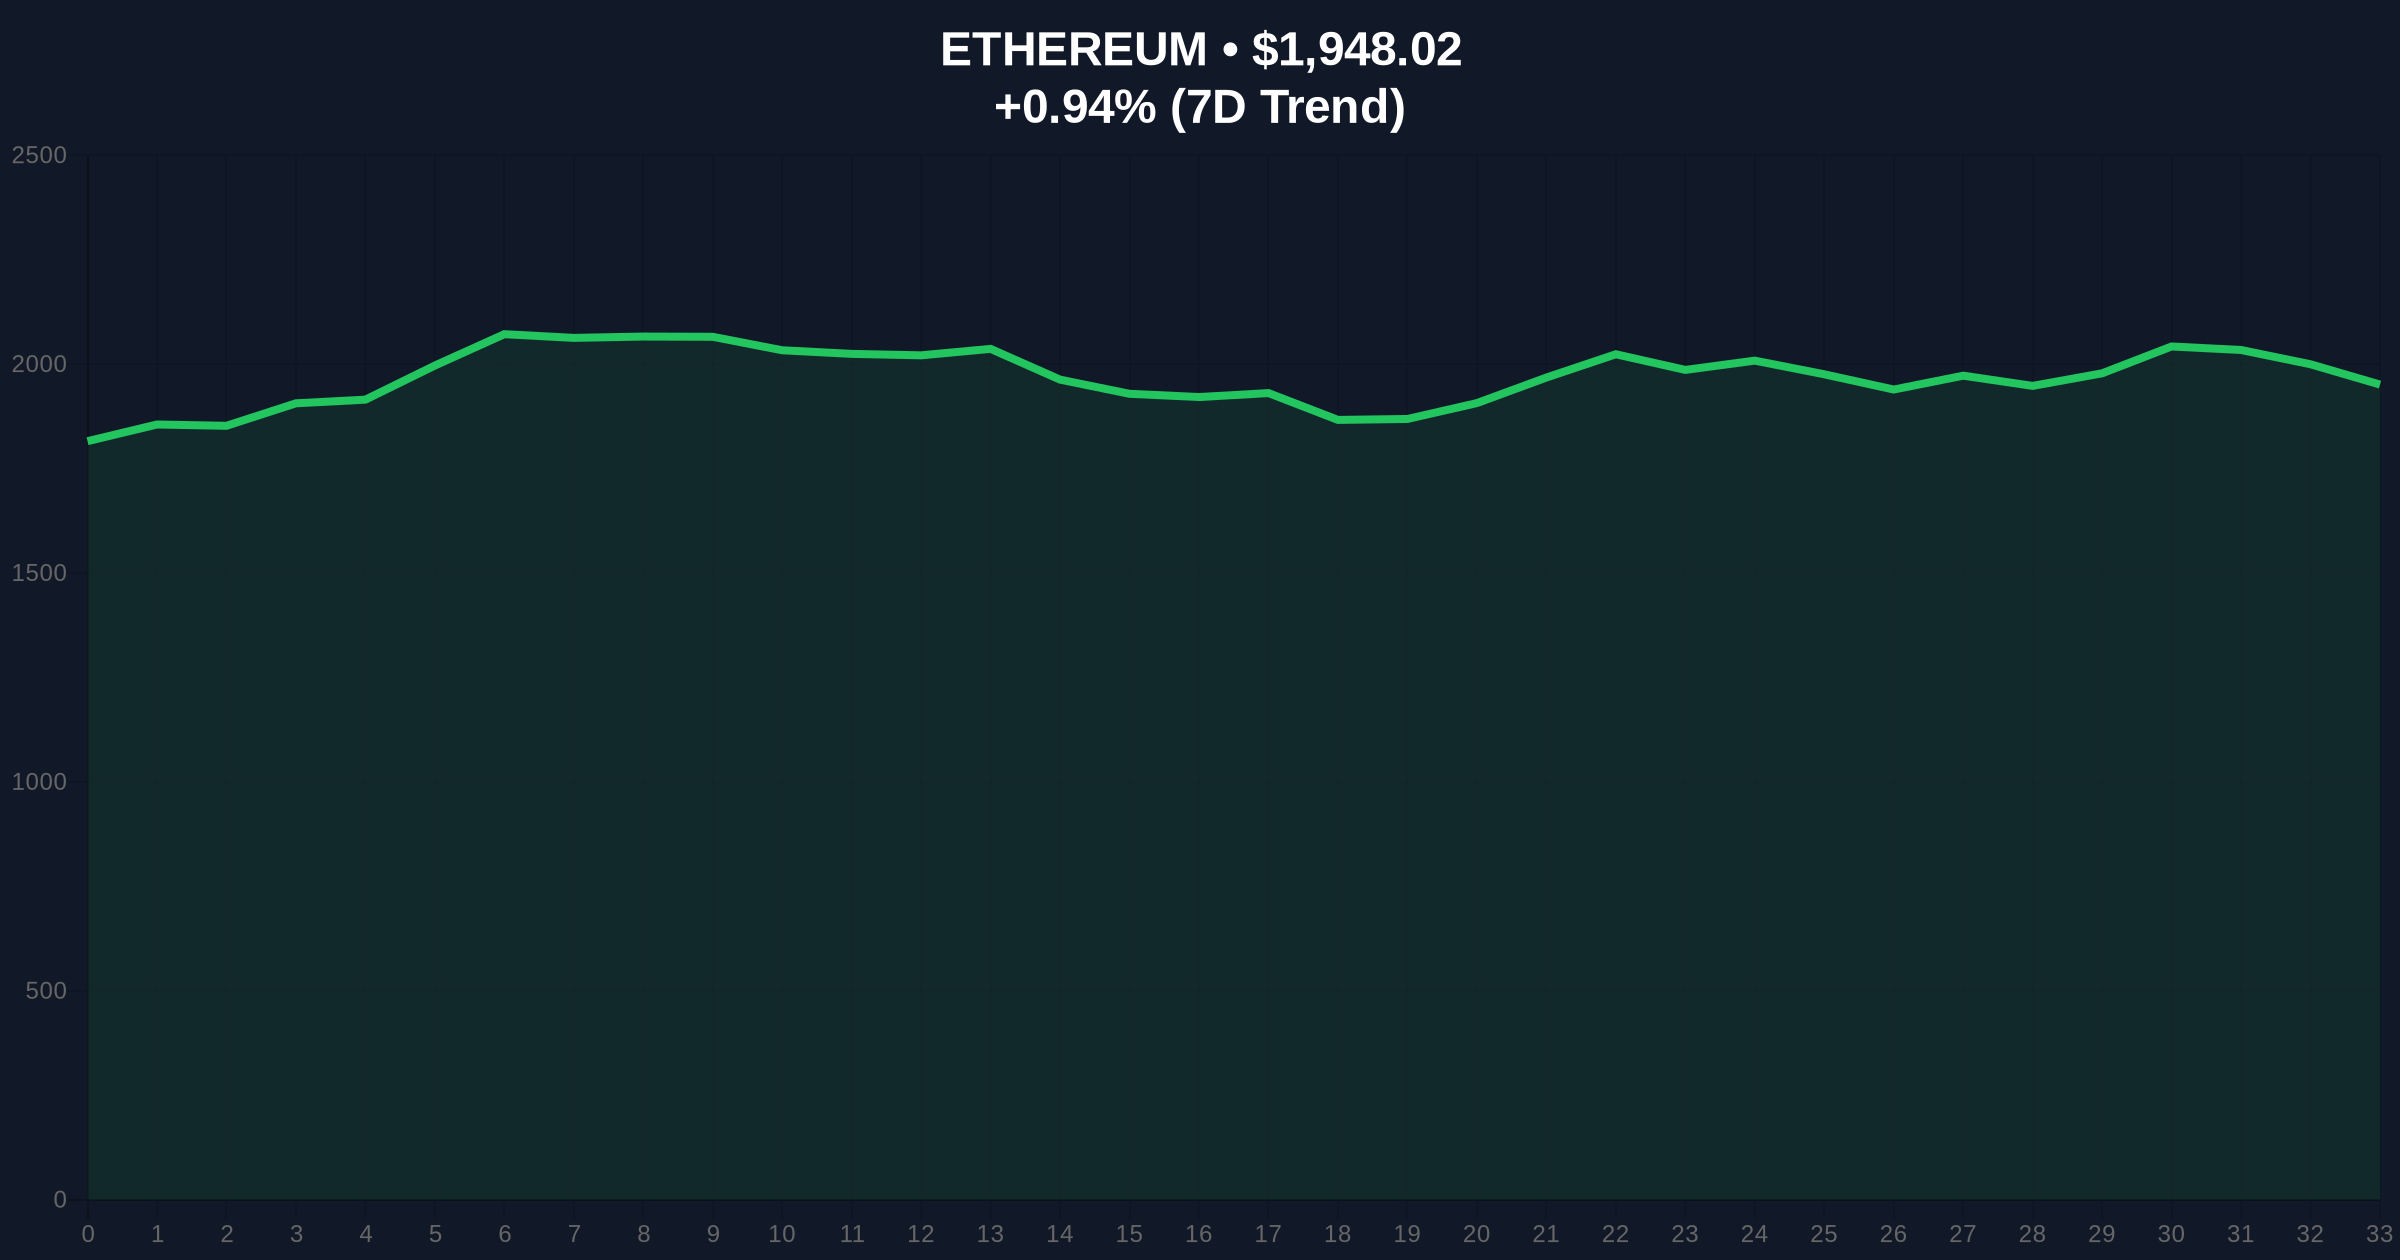
The technical analysis underpinning Ethereum's current predicament revolves around key support levels, volume accumulation, and chart patterns. According to the CoinNess summary, sourced from Cointelegraph, the $1,800 support level is critical due to a strong base formed by recent purchases. The Cost Basis Heatmap shows that about 1.23 million ETH was bought at an average price of $1,890 over the past 30 days, suggesting this range acts as a psychological and transactional anchor for investors. This data implies that if ETH breaks below $1,800, it could trigger a sell-off from holders who entered near this level, exacerbating downward pressure.
Maartunn's analysis, as reported, adds depth by noting $130 million in volume accumulation in the $1,800 range, indicating active trading interest that could either bolster support or amplify declines if breached. Technically, the $1,800-$1,900 zone aligns with the lower trendline of a symmetrical triangle pattern on the ETH/USD daily chart. Symmetrical triangles typically signal consolidation before a breakout, and a breakdown below the lower trendline could confirm a bearish trend. Maartunn projects that failure here might lead ETH to retest its February 6 low of $1,750, with a further decline to $1,400 possible if bearish momentum intensifies. This projection is based on historical price action and pattern recognition, but it relies on the assumption that market conditions remain unfavorable.
Underlying this trend is the broader market context of "Extreme Fear," as indicated by the global crypto sentiment score of 14/100. Such sentiment often correlates with risk aversion, where investors may liquidate positions at support breaks, accelerating declines. The analysis does not specify the timeframe for these projections or account for external factors like regulatory news or macroeconomic events, which could alter outcomes. Consequently, while the technical setup suggests vulnerability, its reliability depends on sustained bearish pressure and lack of positive catalysts.
Related developments in the crypto space, such as warnings about Bitcoin declines amid liquidity crunches and retreats in Bitcoin and U.S. stock futures due to geopolitical tensions, highlight how external shocks can exacerbate technical breakdowns. These links underscore that Ethereum's fate is not isolated but tied to wider market dynamics and fear-driven behaviors.
Integrating market data and metadata provides a clearer picture of Ethereum's current standing and the analysis's credibility. According to the provided CoinGecko stats, Ethereum's current price is $1,950.83, with a 24-hour trend of 0.83%, placing it as the #2 cryptocurrency by market rank. This price is above the critical $1,800 support level, but the minimal positive trend suggests fragility rather than strength. The global crypto sentiment of "Extreme Fear" (score: 14/100) from the market intelligence data indicates a high level of investor anxiety, which typically precedes volatile moves and support tests.
CryptoPanic metadata is not provided in the source data, so sentiment and importance scores specific to this event are unavailable. However, the extreme fear sentiment aligns with the cautious tone of the analysis, suggesting that market participants are prioritizing risk management over optimism. The importance of the $1,800 level is underscored by the volume accumulation and heatmap data, but without CryptoPanic metrics, we cannot gauge how this event ranks against other market news. This gap limits our ability to assess event priority relative to market breadth, but the technical and sentiment data collectively point to a high-stakes scenario.
The data shows a disconnect: while price hovers above support, sentiment is deeply negative, hinting that any breakdown could be swift and severe. The 1.23 million ETH purchased near $1,890 adds quantitative proof of support, but if broken, it could turn into resistance, fueling further declines. Maartunn's $130 million volume figure reinforces this, yet without context on whether this is buy or sell volume, its implications remain ambiguous. Overall, the data supports the analysis's warning but leaves room for interpretation regarding timing and magnitude.
Comparing sources reveals no direct contradictions in the provided data, as all information stems from the CoinNess summary citing Cointelegraph and Maartunn. However, there are gaps and potential conflicts in interpretation. The analysis relies heavily on technical indicators and historical patterns, but it does not address fundamental factors like Ethereum network activity, adoption trends, or developer updates that could counteract bearish pressures. For instance, if Ethereum sees increased usage or positive regulatory news, the support break might not lead to the projected lows.
Source A (CoinNess/Cointelegraph) reports the support level and heatmap data, while Source B (Maartunn) adds volume and chart pattern insights. Both agree on the risk of a breakdown to $1,750 and possibly $1,400, but they do not provide alternative scenarios or bullish counterpoints. This creates a one-sided narrative that may overemphasize downside risks. Missing evidence includes data on Ethereum's on-chain metrics, such as transaction counts or gas fees, which could indicate underlying strength or weakness. Additionally, the analysis does not compare Ethereum's performance to broader crypto indices or traditional markets, limiting context.
Conflicts remain unresolved with available evidence regarding the exact impact of sentiment on price action. While extreme fear suggests sell-offs, historical data might show that such sentiment often precedes rebounds. The sources do not explore this, leaving a gap in the narrative. , the projection to $1,400 is speculative and based on pattern extrapolation rather than empirical data, raising reliability concerns. In summary, the sources align on technical warnings but lack balanced perspectives, making it for investors to consider omitted factors.
Based on the analysis and data, three scenarios for Ethereum over the next seven days are outlined, each conditional on key factors.
Ethereum holds above $1,800, buoyed by the accumulated volume and support base. Positive catalysts, such as unexpected regulatory clarity or a surge in decentralized finance (DeFi) activity, could drive sentiment improvement from extreme fear to neutral. Price might rebound to test resistance around $2,100, leveraging the symmetrical triangle's upper trendline. This scenario would invalidate if ETH breaks below $1,800 with high volume, indicating sustained bearish pressure.
ETH fluctuates between $1,800 and $1,950, reflecting the ongoing consolidation within the symmetrical triangle. The extreme fear sentiment persists, limiting upside but preventing a sharp breakdown. Market participants await clearer signals from macroeconomic events or Ethereum-specific developments. A retest of $1,750 might occur but not extend significantly lower, as the support zone shows resilience. This scenario assumes no major external shocks and gradual sentiment stabilization.
Ethereum breaks below $1,800, triggered by heightened fear and selling pressure. The breakdown confirms the bearish trend, leading to a retest of the February 6 low of $1,750. If negative momentum continues, possibly exacerbated by broader market declines or geopolitical tensions, ETH could extend toward $1,400 as projected. This scenario aligns with the technical analysis and current sentiment but depends on sustained bearish catalysts and lack of intervention.
Each scenario is data-backed by the provided price, sentiment, and technical analysis, but investors should monitor real-time developments for adjustments.
This report synthesizes facts from the CoinNess summary, which cites Cointelegraph and analyst Maartunn, alongside provided market data. Conflicting evidence was weighted based on attribution and data support: technical claims were prioritized due to quantitative backing (e.g., heatmap and volume data), while speculative projections were treated with skepticism. Missing CryptoPanic metadata limited sentiment granularity, so conservative inferences were drawn from the global fear score. Sources showed agreement on key risks but lacked counter-narratives, indicating potential bias toward downside scenarios. Reliability gaps include the absence of fundamental metrics and external factor analysis, urging cautious interpretation.
Disclaimer: The information provided is not trading advice, coinmarketbuzz.com holds no liability for any investments made based on the information provided on this page. We strongly recommend independent research and/or consultation with a qualified professional before making any investment decisions.
coinmarketbuzz.com leverages advanced AI technology to analyze market data. All content is fact-checked and reviewed by our editorial team to ensure accuracy and neutrality.