Loading News...
Loading...
Loading News...

VADODARA, February 10, 2026 — Bloomberg ETF analyst James Seyffart confirms Ethereum ETF holders face a $1,500 unrealized loss per share. His analysis reveals an average purchase price of $3,500 against a current spot price of $2,000. This daily crypto analysis examines the structural implications for market liquidity and price discovery.
James Seyffart's statement highlights a critical market inefficiency. According to Bloomberg Intelligence data, Ethereum ETF holders purchased at an average cost basis of $3,500. The current market price sits at approximately $2,000. This creates a 42.9% unrealized loss across the ETF complex.
Market structure suggests this represents a massive liquidity grab. Sellers trapped above $3,500 create a persistent supply overhang. Consequently, any rally toward that level faces immediate selling pressure from underwater holders seeking breakeven.
Seyffart noted this is not a new phenomenon for Ethereum investors. Historical cycles indicate similar patterns during the 2018 and 2022 bear markets. However, the scale is now institutional. Billions in ETF capital sit at a significant loss.
This situation mirrors Bitcoin's 2022 cycle. Bitcoin ETF holders then faced a 30% average drawdown. Ethereum's current 42.9% deficit is more severe. Underlying this trend is the broader macro environment of rising real yields.
Historically, such large unrealized losses precede prolonged consolidation phases. The market must absorb this overhang through time or price. In contrast, Bitcoin currently trades near all-time highs, providing its ETF holders with paper profits.
, the global crypto sentiment index reads "Extreme Fear" with a score of 9/100. This amplifies the negative feedback loop. Fear-driven selling meets trapped ETF liquidity. The result is compressed volatility and weak directional momentum.
Related Developments: This extreme fear environment coincides with other market shifts. Prediction market volume has surged to $63.5B, indicating heightened hedging activity. Simultaneously, Bitcoin's Mayer Multiple has dropped to 0.65, signaling potential deeper downside risk across the asset class.
On-chain data from Glassnode indicates weak holder conviction. The Net Unrealized Profit/Loss (NUPL) metric for Ethereum sits in the "Fear" zone. This aligns with the ETF cost basis analysis. Price action shows Ethereum struggling below the 200-day moving average.
A critical Fair Value Gap (FVG) exists between $2,150 and $2,300. This zone represents inefficient price discovery from the rapid sell-off. Market technicians watch this FVG as a potential liquidity target for any short-term rally.
The Volume Profile Point of Control (VPOC) anchors near $1,950. This level coincides with the Fibonacci 0.618 retracement from the 2024 low. Consequently, $1,950 acts as major support. A breakdown here would target the $1,750 order block from Q3 2024.
Ethereum's network fundamentals add complexity. According to Ethereum.org, post-merge issuance remains near zero. However, staking yields have compressed. This reduces the opportunity cost for sellers, potentially increasing liquid supply.
| Metric | Value | Implication |
|---|---|---|
| Ethereum Current Price | $2,000 | Key psychological level |
| ETF Holder Avg Cost | $3,500 | $1,500 unrealized loss/share |
| Unrealized Loss % | 42.9% | Severe liquidity overhang |
| Crypto Fear & Greed Index | 9/100 (Extreme Fear) | Amplifies selling pressure |
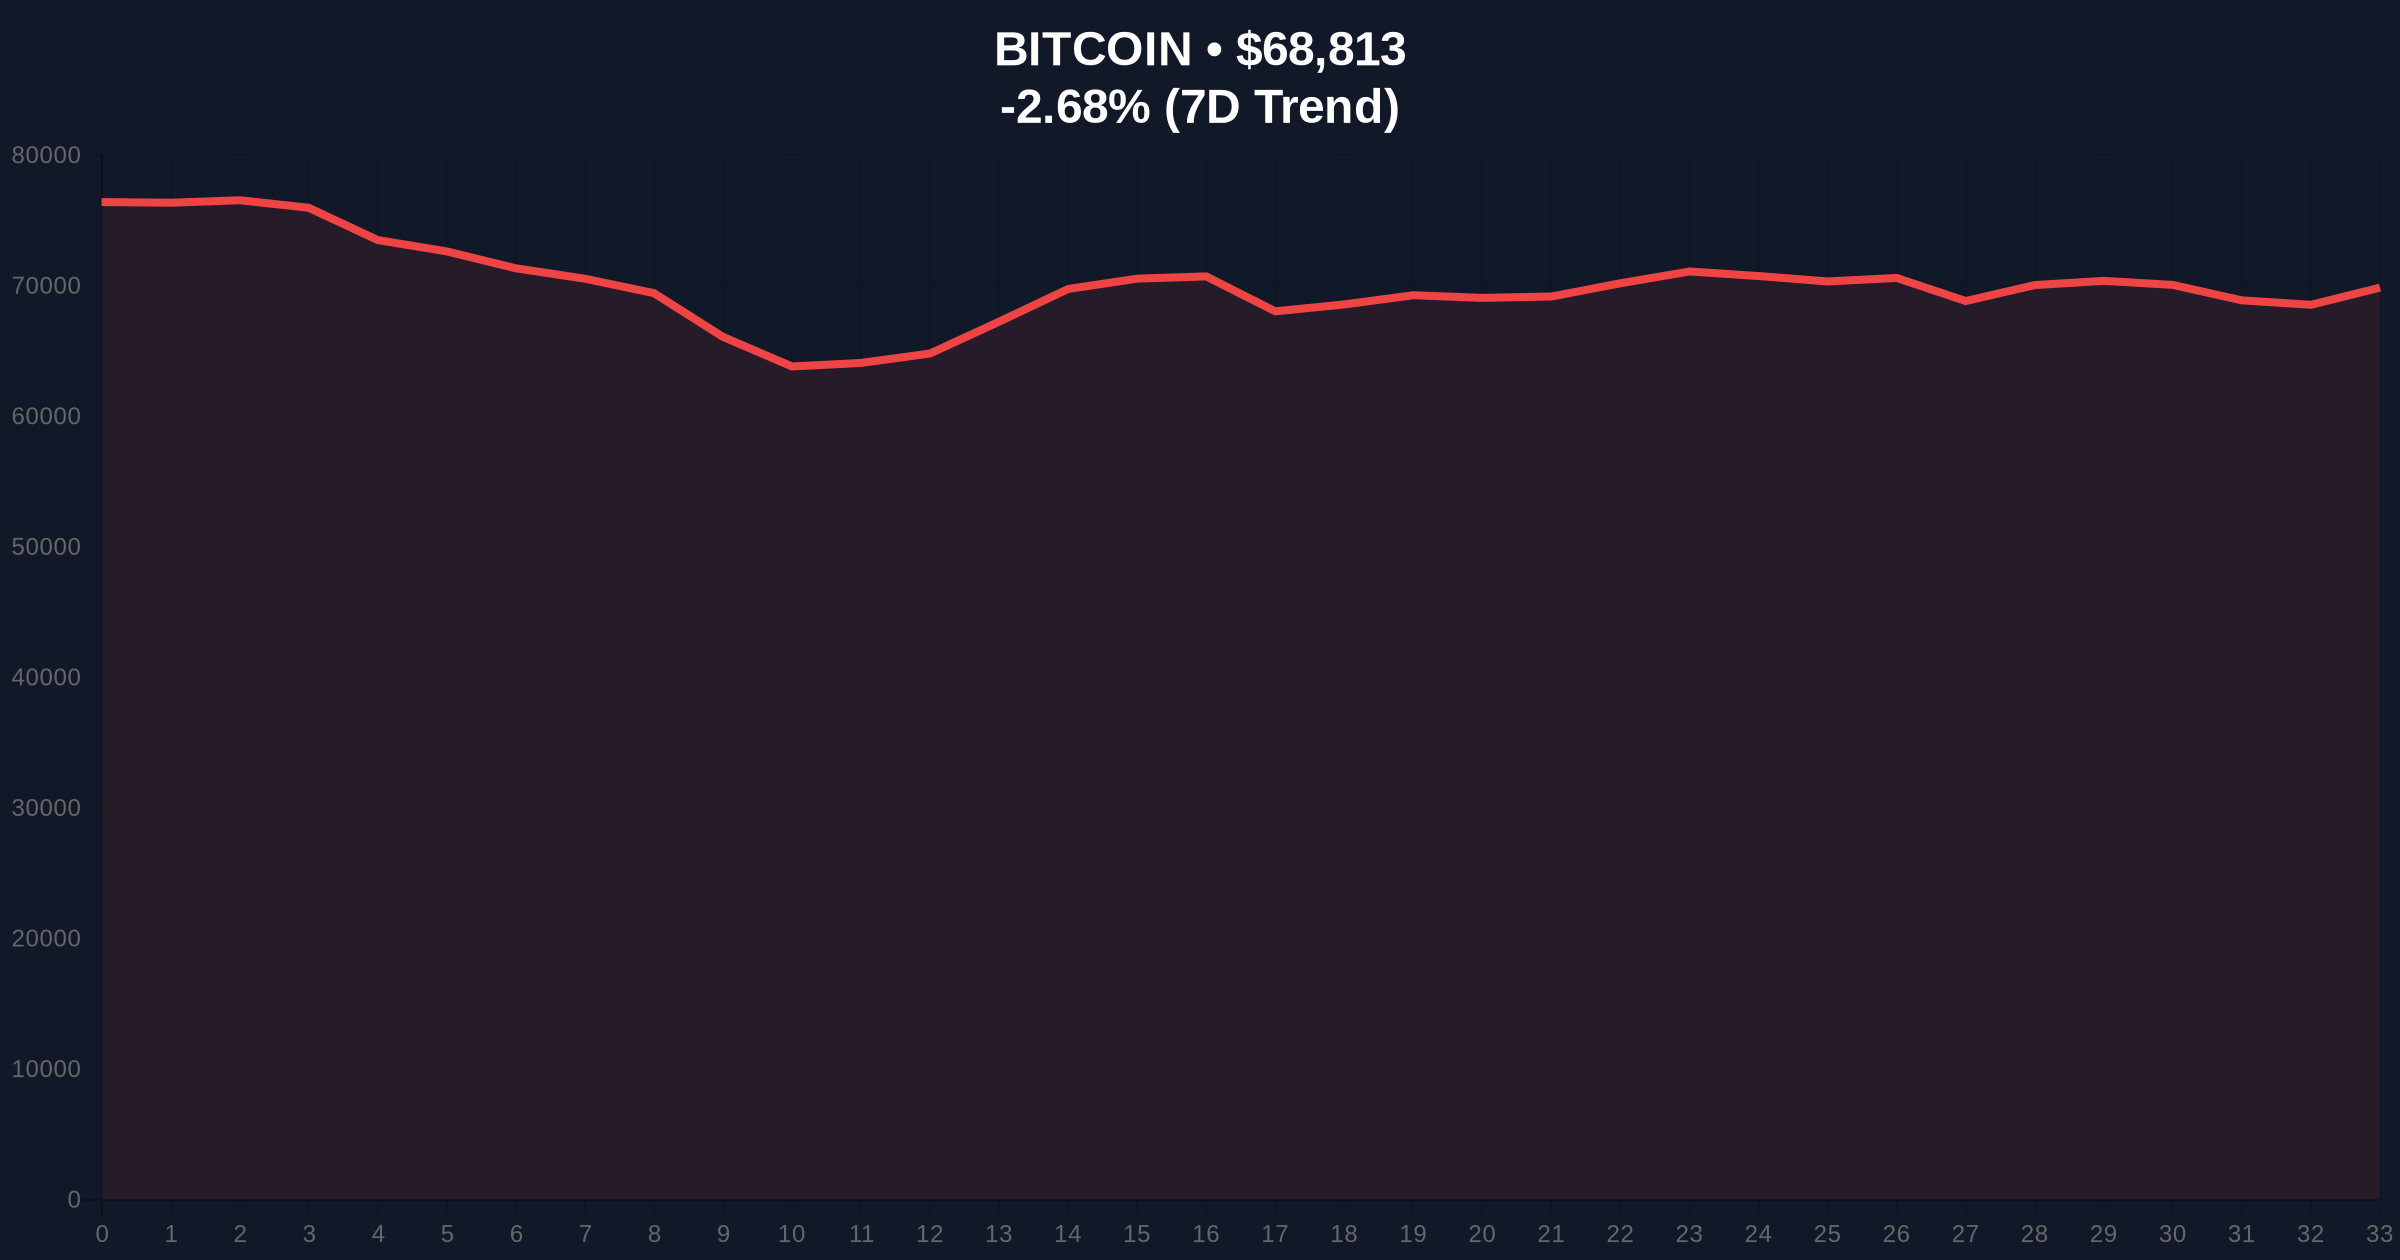
| Bitcoin 24h Trend | -2.69% | Correlated downside risk |
This matters for portfolio construction. The $1,500 per-share loss represents trapped institutional capital. These holders are unlikely to sell at a 42.9% loss. Instead, they will wait for breakeven. This creates a "supply wall" near $3,500.
Market structure suggests this wall will cap rallies for the medium term. Any approach to $3,000 will trigger sell orders. Consequently, the path of least resistance remains sideways to down until this overhang clears.
Retail sentiment exacerbates the issue. The Extreme Fear reading indicates panic selling on minor dips. This provides liquidity for larger players to accumulate at lower levels. The cycle repeats until fear subsides.
"The ETF cost basis discrepancy is a textbook liquidity trap. It creates a self-fulfilling prophecy of resistance. Until that wall is either absorbed or broken, Ethereum faces headwinds that Bitcoin does not. This is a market structure problem, not a fundamentals problem."
Two primary scenarios emerge from current data.
The 12-month institutional outlook remains cautious. Historical cycles suggest 6-12 months of consolidation are needed to resolve such large cost basis disparities. The upcoming Ethereum Pectra upgrade, including EIP-7702, could provide a catalyst. However, technical resistance near $3,500 will likely limit upside until 2027.

Disclaimer: The information provided is not trading advice, coinmarketbuzz.com holds no liability for any investments made based on the information provided on this page. We strongly recommend independent research and/or consultation with a qualified professional before making any investment decisions.
coinmarketbuzz.com leverages advanced AI technology to analyze market data. All content is fact-checked and reviewed by our editorial team to ensure accuracy and neutrality.