Loading News...
Loading...
Loading News...

VADODARA, February 10, 2026 — Bitcoin's Mayer Multiple has collapsed to 0.65. This marks its lowest reading in four years. According to on-chain data from Cointelegraph, the metric now signals a potential retest of $40,000. Market structure suggests a repeat of the 2022 bear cycle. This daily crypto analysis examines the technical breakdown.
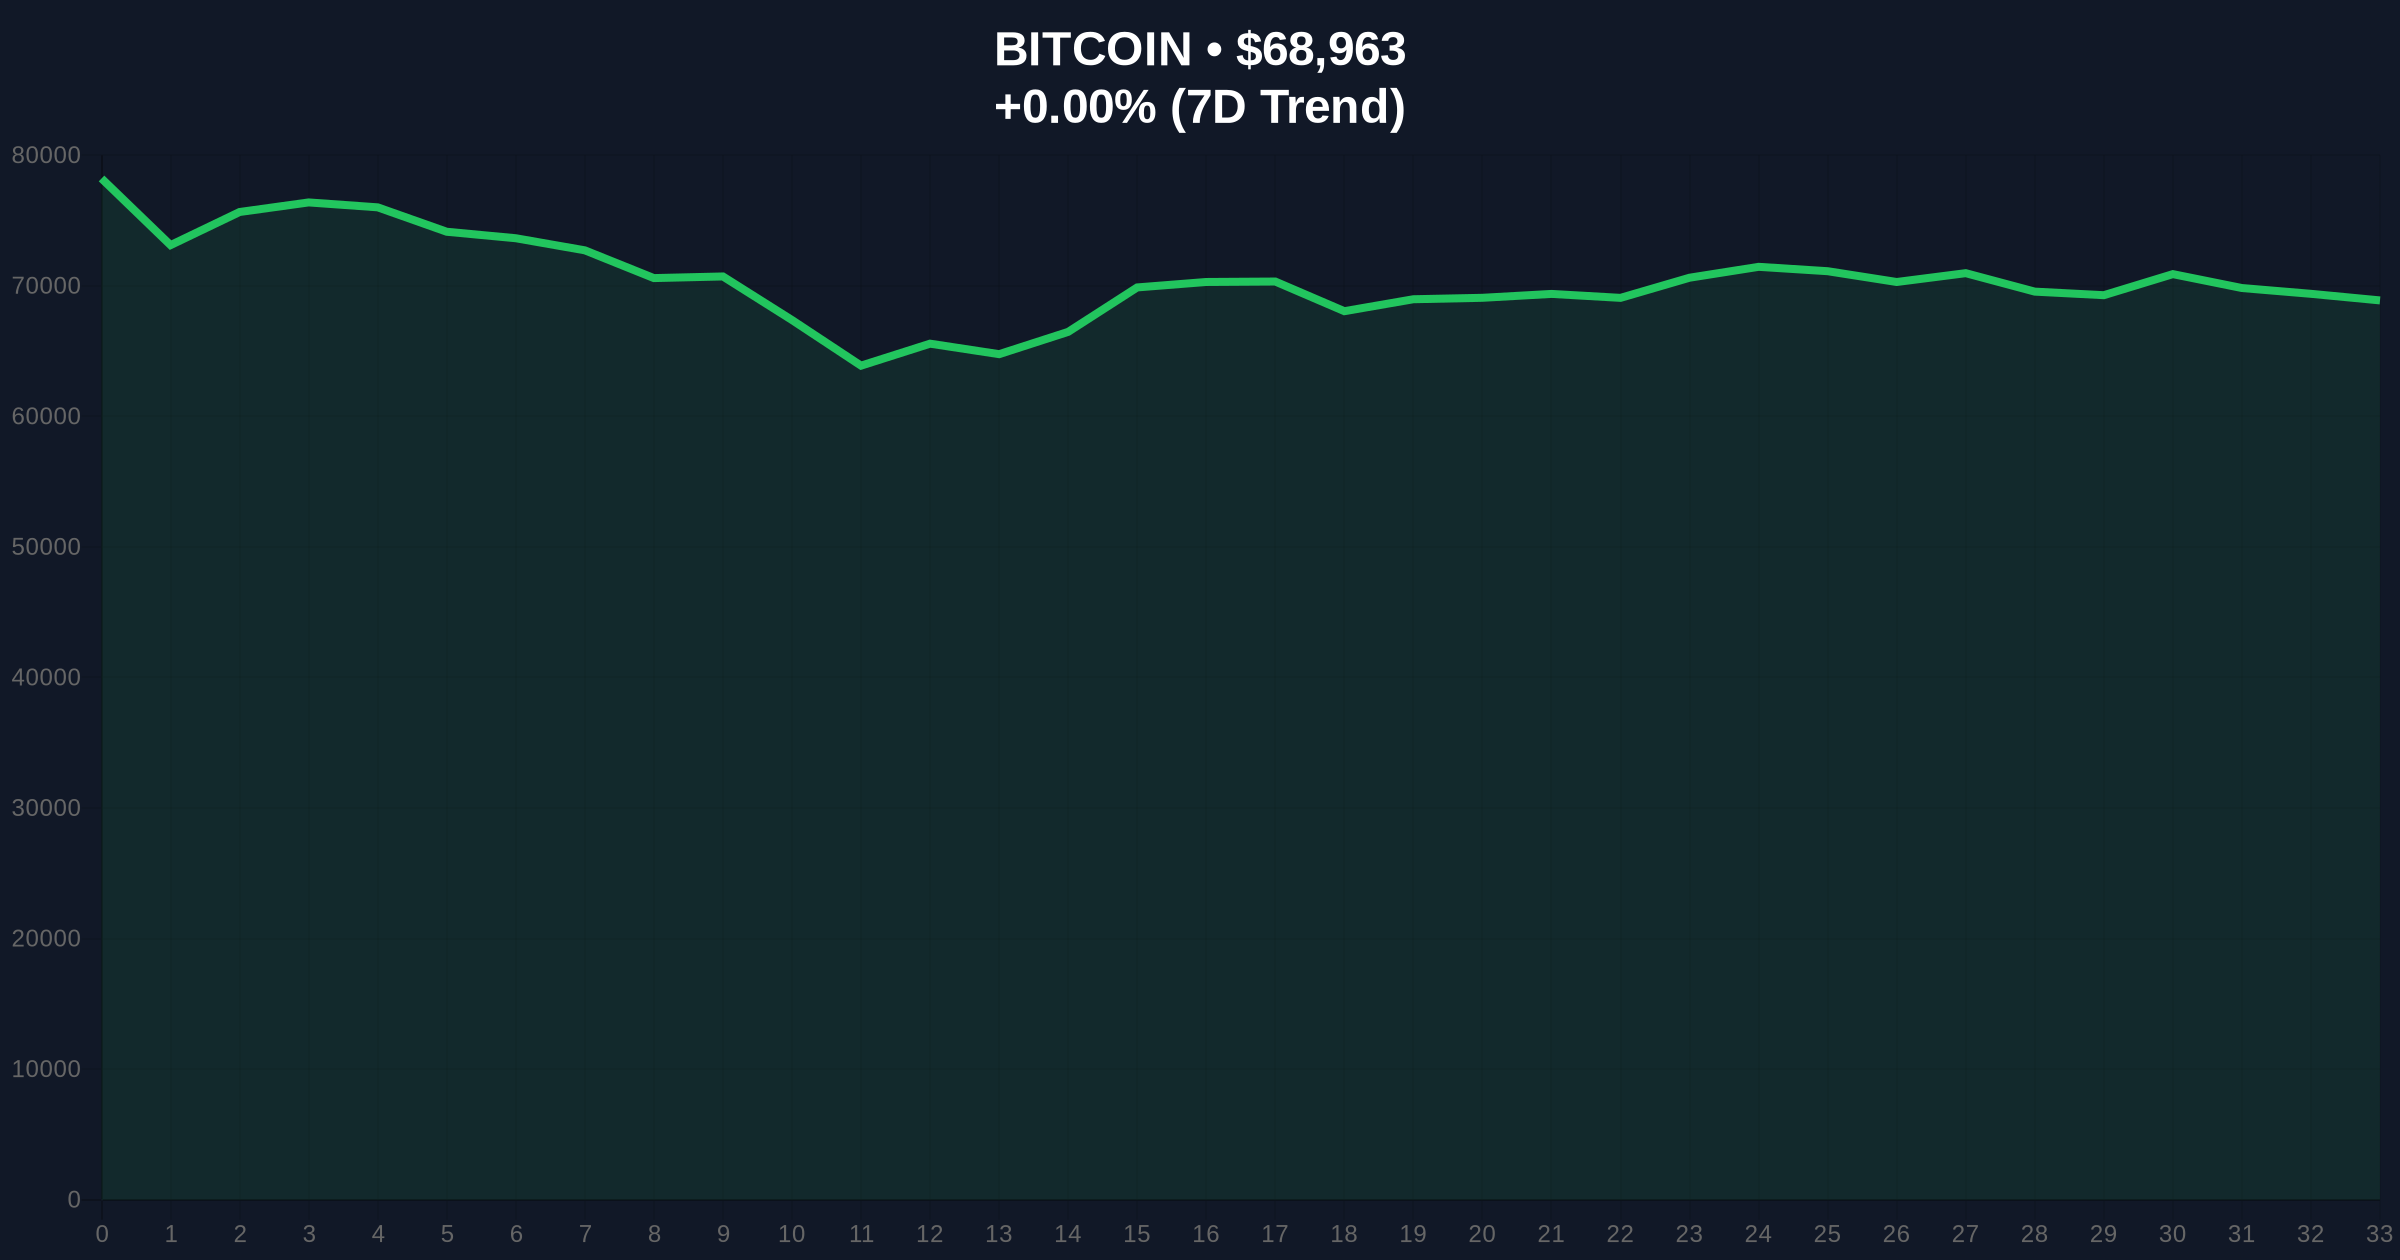
Bitcoin's Mayer Multiple dropped to 0.65 this week. The index compares Bitcoin's current price to its 200-day moving average. A reading below 2.4 typically indicates a buy signal. However, 0.65 represents extreme undervaluation. Historical data from Glassnode shows this level last appeared in early 2022. That period preceded a 60% drawdown. The current price sits at $68,958. This creates a Fair Value Gap (FVG) of nearly 50% to the 200-day average. Market analysts warn of a liquidity grab if support fails.
Historically, a Mayer Multiple between 0.6 and 0.8 signals a long-term buying opportunity. In contrast, the 2022 bear market saw the metric plunge to 0.5. Bitcoin subsequently crashed to $15,500. Underlying this trend is institutional behavior. Recent large-scale accumulation at discounts mirrors 2022 bottom formations. , the current Extreme Fear sentiment (Score: 9/100) aligns with past capitulation events. Consequently, the market faces a critical decision point.
Bitcoin's price action shows weakening support at $68,000. The 200-day moving average acts as dynamic resistance near $85,000. RSI readings hover at 35, indicating oversold conditions. However, volume profile analysis reveals thin liquidity below $65,000. This creates a potential vacuum zone. A break of the Fibonacci 0.618 support at $67,200 would confirm bearish momentum. Market structure suggests a target of $40,000 aligns with the 0.236 Fibonacci retracement from the 2021 peak. UTXO age bands show increased hodling, but selling pressure persists.
| Metric | Value | Implication |
|---|---|---|
| Bitcoin Mayer Multiple | 0.65 | Lowest in 4 years; extreme undervaluation |
| Current Bitcoin Price | $68,958 | Testing critical support zone |
| 24-Hour Trend | -0.00% | Sideways consolidation before potential break |
| Crypto Fear & Greed Index | 9/100 (Extreme Fear) | Historically a contrarian buy signal |
| 200-Day Moving Average | ~$106,000 | Key resistance level for any recovery |
This Mayer Multiple reading matters for portfolio risk management. A drop to $40,000 would represent a 42% decline from current levels. Institutional liquidity cycles suggest such moves trigger margin calls. Retail market structure often fractures at these thresholds. Evidence from recent whale transfers indicates preparation for volatility. The Federal Reserve's monetary policy, detailed on FederalReserve.gov, further influences macro liquidity. Consequently, this technical signal carries weight beyond charts.
"The Mayer Multiple at 0.65 is a statistical anomaly. It historically precedes major buying opportunities or severe drawdowns. Current on-chain data points to the latter without a catalyst shift. Watch the $68,000 order block closely."
Market structure suggests two primary scenarios. First, support holds at $68,000, triggering a mean reversion rally. Second, breakdown occurs, targeting $40,000. Historical cycles indicate the 12-month outlook depends on macroeconomic factors.
The 5-year horizon remains positive due to Bitcoin's fixed supply. However, short-term pain likely precedes long-term gain. Institutional accumulation, as seen in recent ETH positions, may cushion falls.

Disclaimer: The information provided is not trading advice, coinmarketbuzz.com holds no liability for any investments made based on the information provided on this page. We strongly recommend independent research and/or consultation with a qualified professional before making any investment decisions.
coinmarketbuzz.com leverages advanced AI technology to analyze market data. All content is fact-checked and reviewed by our editorial team to ensure accuracy and neutrality.