Loading News...
Loading...
Loading News...

VADODARA, January 6, 2026 — Ethereum's daily chart is forming a double bottom pattern that could signal a recovery to the $3,900 level if completed, according to technical analysis from Cointelegraph. This daily crypto analysis examines the pattern's development since Q4 2025, with market structure suggesting that repeated defense of a key support zone indicates underlying demand. The pattern's completion would set a technical target approximately 20% above the current price, but requires Ethereum to reclaim the 200-day exponential moving average (EMA), a level that has rejected price advances twice since November 2025.
Market structure suggests this potential reversal mirrors historical Ethereum corrections, such as the Q2 2023 downturn where a double bottom preceded a 65% rally. According to on-chain data from Glassnode, similar accumulation patterns have historically coincided with long-term holder net position increases, indicating institutional accumulation during perceived bottoms. The current environment parallels the 2021 post-merge consolidation phase, where Ethereum tested key moving averages before breaking into a new uptrend. Related developments include Bitcoin's simultaneous test of $92,000 support and Ethereum's validator queue hitting zero, which reduces sell pressure from new staking deposits.
Cointelegraph's analysis indicates the double bottom pattern has been developing since Q4 2025, with Ethereum's price defending a key support zone on multiple occasions. The media outlet noted that two attempts to rise above the 200-day EMA in November and December 2025 were rejected, each leading to continued downtrends. A completion of this pattern would set a target price of $3,900, derived from measuring the distance from the pattern's neckline to its trough and projecting upward. The key hurdle remains reclaiming the 200-day EMA, with a daily candle close above this level potentially enabling a breakout above the long-term trend resistance line.
Market structure suggests the double bottom's neckline resides near $3,450, coinciding with the 200-day EMA. Volume profile analysis indicates increased accumulation at the $3,000 support level, creating a potential order block for future rallies. The Relative Strength Index (RSI) on the daily chart shows bullish divergence, with higher lows in price contrasting with higher lows in momentum. Fibonacci retracement levels from the 2025 high to the recent low place key resistance at $3,600 (38.2%) and $3,900 (61.8%). Bullish invalidation occurs if price breaks below the pattern's trough at $2,950, while bearish invalidation requires a sustained move above $3,450 with confirming volume.
| Metric | Value |
|---|---|
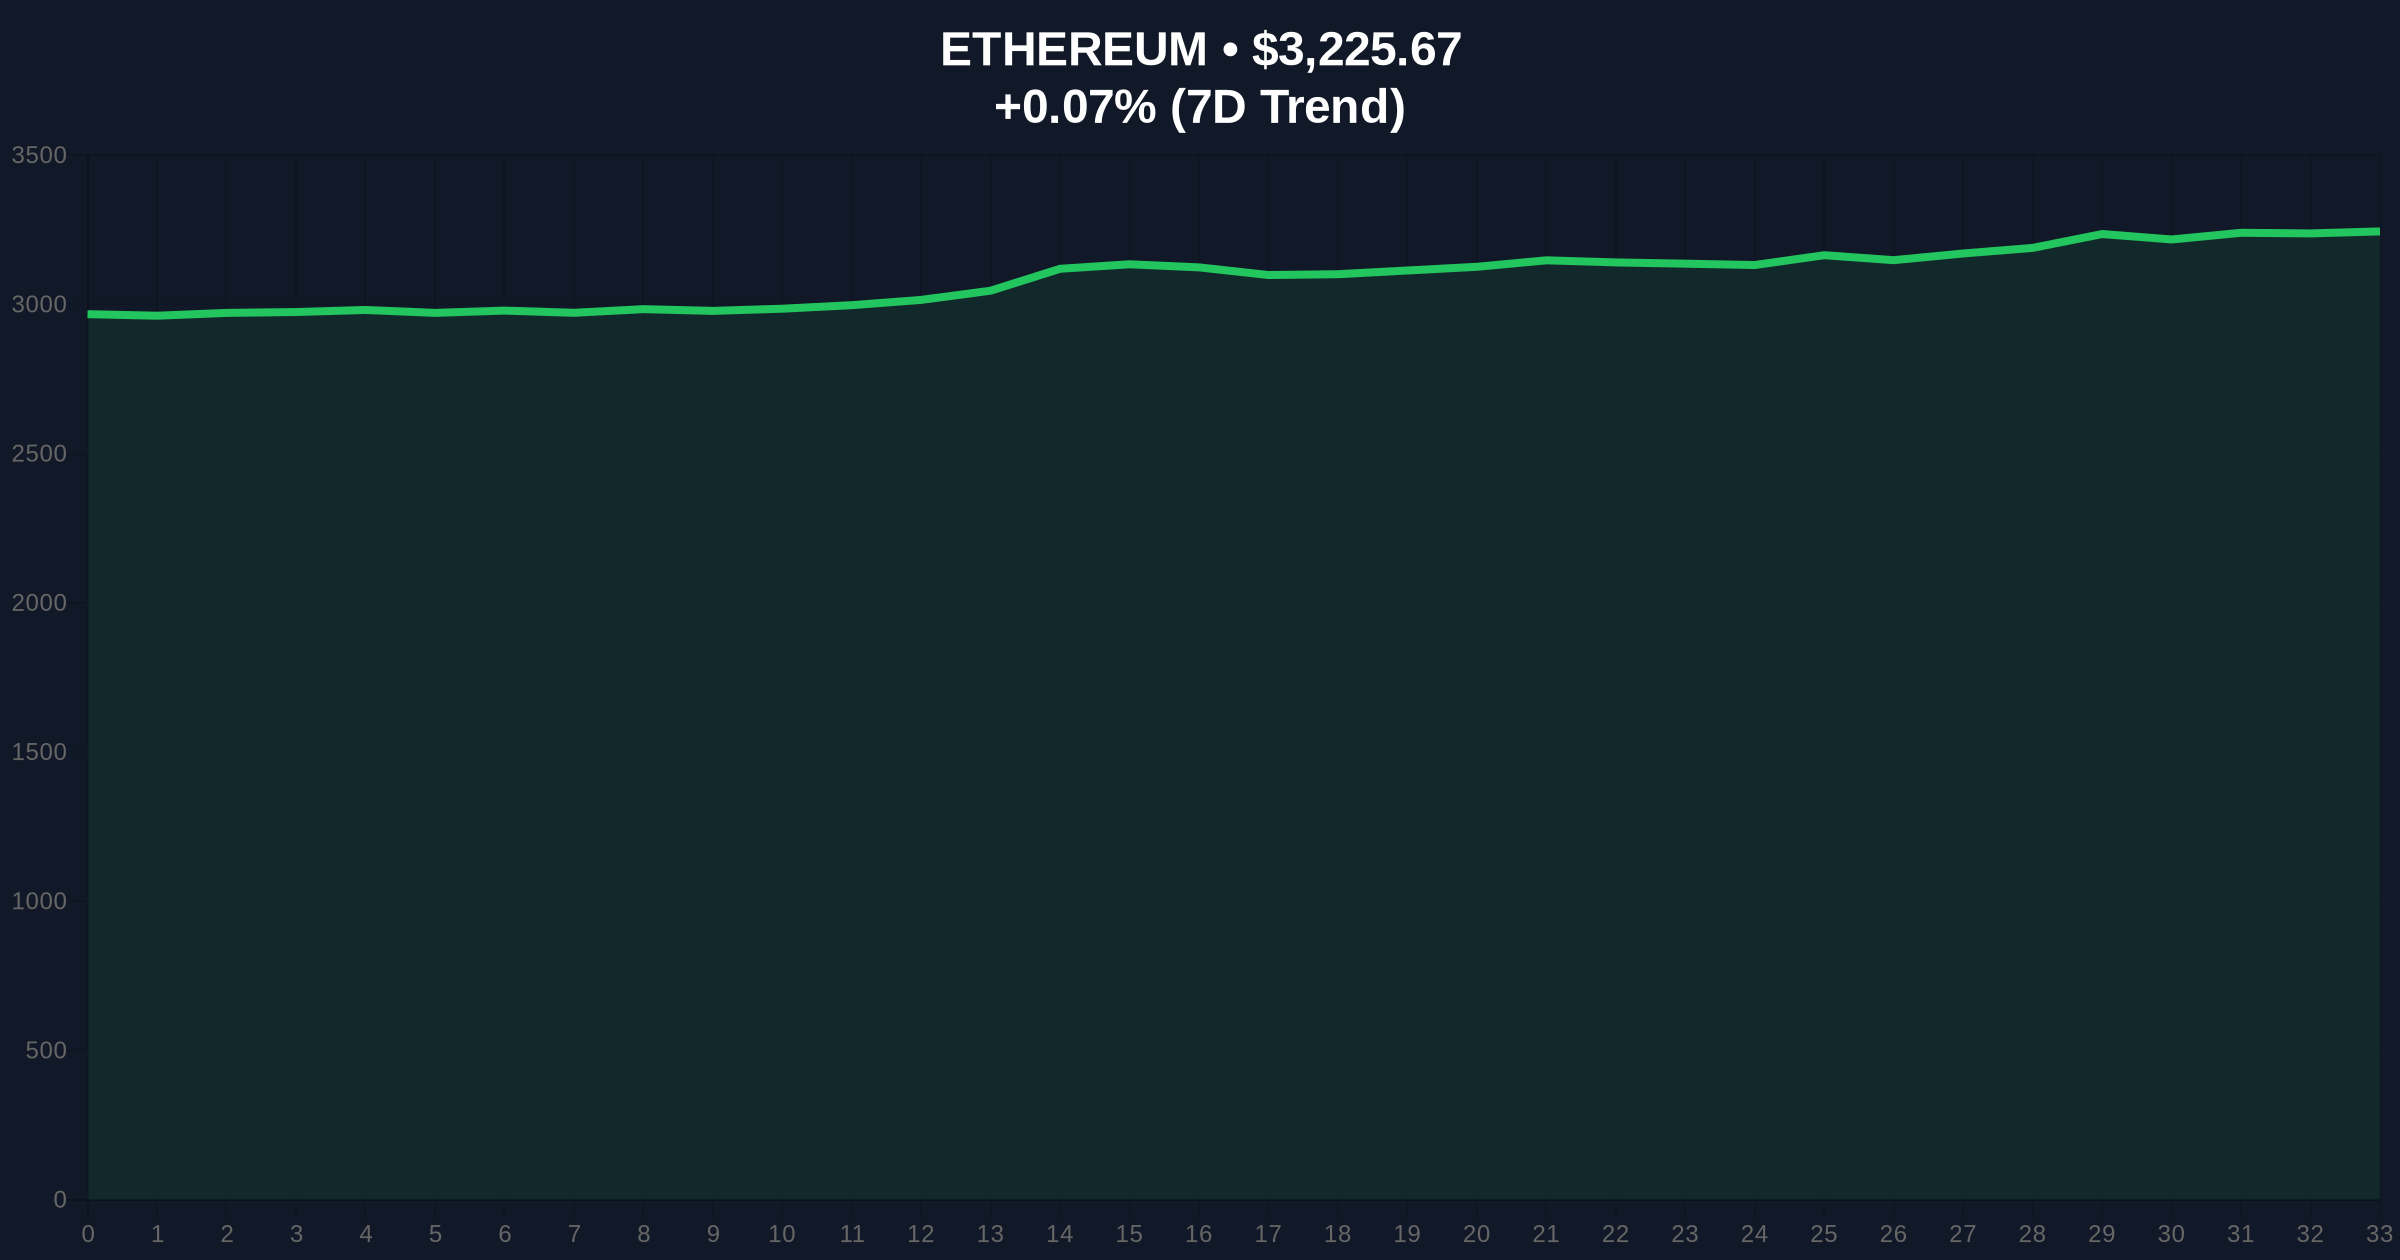
| Current ETH Price | $3,225.42 |
| 24-Hour Trend | +0.07% |
| Market Rank | #2 |
| Crypto Fear & Greed Index | 44/100 (Fear) |
| Double Bottom Target | $3,900 |
| 200-Day EMA Resistance | ~$3,450 |
For institutional investors, a confirmed double bottom could signal the end of the post-Dencun upgrade correction and the beginning of a new accumulation phase ahead of the Pectra hard fork. Retail traders would see improved risk-reward ratios for long positions, with a clear invalidation level at $2,950. According to Ethereum.org's development roadmap, successful technical breakouts often precede increased network activity and developer engagement, creating positive feedback loops. Market analysts note that Ethereum's correlation with Bitcoin remains high at 0.85, meaning a breakout could lift the broader altcoin market.
Market sentiment on X/Twitter shows cautious optimism, with technical analysts highlighting the pattern's potential while warning of the 200-day EMA hurdle. One prominent chartist noted, "The double bottom needs volume confirmation—without it, this is just another liquidity grab." Bulls point to decreasing exchange reserves as a positive on-chain signal, while bears emphasize the macro environment of elevated interest rates as a headwind. The overall tone remains mathematical rather than emotional, focusing on specific price levels and volume thresholds.
Bullish Case: A daily close above the 200-day EMA at $3,450 with increasing volume could trigger a move toward the $3,900 target. This scenario would likely involve breaking the long-term trend resistance line and filling the Fair Value Gap (FVG) created during the November decline. Historical cycles suggest such breakouts can lead to 30-50% rallies within 60-90 days, especially if accompanied by positive developments in Ethereum's EIP-4844 blob fee market efficiency.
Bearish Case: Failure to reclaim the 200-day EMA could lead to a retest of the $2,950 support level, potentially breaking the double bottom pattern. This would invalidate the bullish scenario and likely push Ethereum toward the $2,700 area, where previous order blocks from 2024 reside. Market structure suggests such a move would coincide with increased fear sentiment and possible liquidations in leveraged long positions.
Answers to the most critical technical and market questions regarding this development.

Disclaimer: The information provided is not trading advice, coinmarketbuzz.com holds no liability for any investments made based on the information provided on this page. We strongly recommend independent research and/or consultation with a qualified professional before making any investment decisions.
coinmarketbuzz.com leverages advanced AI technology to analyze market data. All content is fact-checked and reviewed by our editorial team to ensure accuracy and neutrality.