Loading News...
Loading...
Loading News...

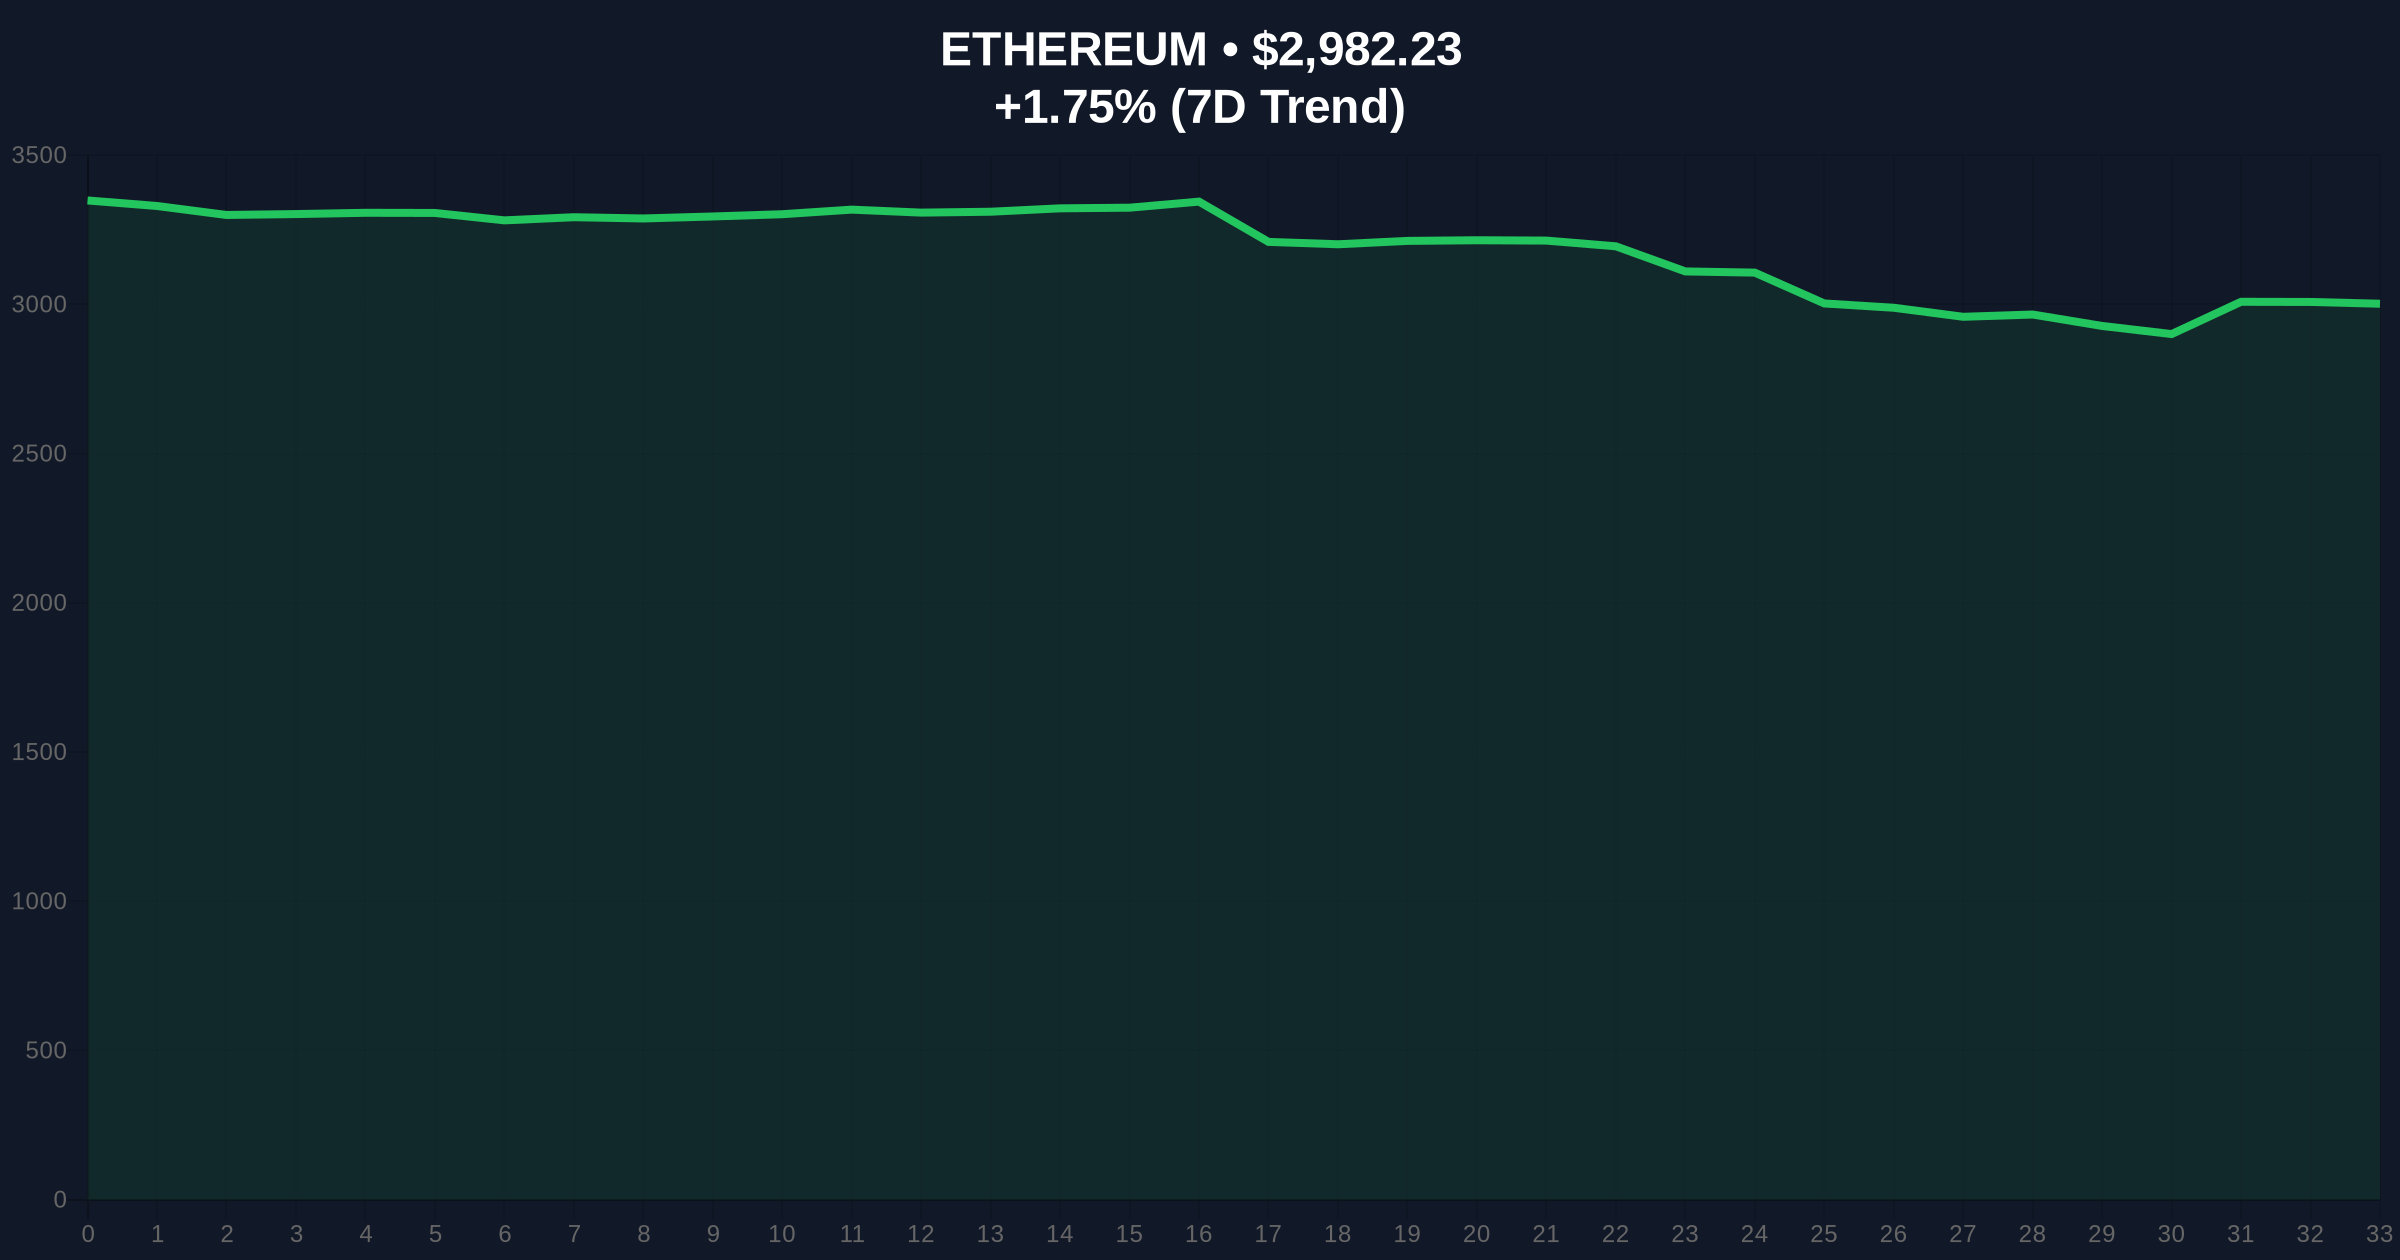
VADODARA, January 22, 2026 — Ethereum has broken below the critical $3,000 support level, forming a classic bear flag pattern that analysts warn could precipitate a drop to $1,850. This daily crypto analysis examines the technical breakdown amid a market gripped by Extreme Fear, with on-chain data revealing key liquidity zones that will determine the next major move.
Ethereum's decline mirrors the post-merge volatility seen in 2023, where similar bear flag formations preceded sharp corrections. The current pattern emerges as global macro pressures, including potential Fed rate hikes, weigh on risk assets. Historical cycles suggest that bear flags in Ethereum often resolve with a measured move equal to the initial decline's length, targeting lower Fibonacci retracement levels. Related developments include institutional tokenization shifts that may influence long-term ETH demand, and analyst predictions of precious metals outperformance in 2026, reflecting broader capital rotation away from crypto.
According to Cointelegraph, multiple analysts identified a bear flag pattern on Ethereum's chart after it breached the $3,000 psychological support. On-chain analyst Kriptoholder noted, via the current ETH order book, a strong buy wall exists between $2,800 and $2,850. Another significant buy wall aligns with the 200-day moving average in the $2,500 to $2,600 range. The analyst added that if these supports fail, the bear flag projects a target near $1,800 to $1,850. Market structure suggests this is a liquidity grab targeting stop-loss orders below key levels.
The bear flag pattern indicates consolidation before a continuation of the downtrend. Key support levels are defined by the buy walls: $2,800-$2,850 (immediate) and $2,500-$2,600 (200-day MA). Resistance sits at the flag's upper boundary near $3,200. RSI readings are approaching oversold territory, but momentum remains bearish. A Fair Value Gap (FVG) exists between $2,900 and $3,100, which may act as a retracement zone. Bullish invalidation level: A close above $3,300 negates the pattern. Bearish invalidation level: A sustained break below $2,500 confirms the downtrend target. Volume profile shows declining activity, typical of flag formations.
| Metric | Value |
|---|---|
| Crypto Fear & Greed Index | 20/100 (Extreme Fear) |
| Ethereum Current Price | $2,981.87 |
| 24-Hour Trend | +1.45% |
| Market Rank | #2 |
| Bear Flag Target | $1,850 |
| Key Support (Buy Wall) | $2,800 - $2,850 |
For institutions, a drop to $1,850 would represent a 38% decline from current levels, impacting ETF holdings and staking yields. Retail traders face liquidation risks, especially in leveraged positions. The breakdown could trigger a gamma squeeze in options markets, exacerbating volatility. Technically, this tests Ethereum's network security post-merge, as lower prices may affect validator economics. According to Ethereum's official documentation, network upgrades like EIP-4844 aim to reduce costs, but price weakness could delay adoption timelines.
Market analysts on X/Twitter are divided. Bulls highlight the buy walls as accumulation zones, citing historical bounces at the 200-day MA. Bears emphasize the bear flag's reliability, with one noting, "Patterns like this have an 80% success rate in crypto." Sentiment aligns with the Extreme Fear index, suggesting capitulation may be near. No major figures like Vitalik Buterin have commented, but on-chain data indicates whale accumulation at $2,800.
Bullish Case: Ethereum holds the $2,800 buy wall, rallies to fill the FVG near $3,100, and invalidates the bear flag. This scenario requires a shift in macro sentiment, possibly driven by positive regulatory news. Target: $3,500.
Bearish Case: The $2,800 support breaks, triggering a cascade to the 200-day MA at $2,500. A breach there confirms the bear flag, targeting $1,850. This aligns with the Extreme Fear sentiment and could see ETH test the 0.618 Fibonacci retracement at $1,800.
Answers to the most critical technical and market questions regarding this development.

Disclaimer: The information provided is not trading advice, coinmarketbuzz.com holds no liability for any investments made based on the information provided on this page. We strongly recommend independent research and/or consultation with a qualified professional before making any investment decisions.
coinmarketbuzz.com leverages advanced AI technology to analyze market data. All content is fact-checked and reviewed by our editorial team to ensure accuracy and neutrality.