Loading News...
Loading...
Loading News...

- US spot Ethereum ETFs recorded $84.59 million net inflow on December 22, 2025
- Inflow ends seven consecutive days of net outflows
- Grayscale's ETHE led with $53.7 million, followed by Mini ETH product with $30.89 million
- Market structure suggests potential reversal from extreme fear sentiment
NEW YORK, December 23, 2025 — Daily crypto analysis reveals US spot Ethereum ETFs recorded a net inflow of $84.59 million on December 22, according to data from TraderT. The inflow ends a seven-day streak of net outflows, marking the first positive flow since December 15. Grayscale's ETHE led the inflows with $53.7 million, followed by its Mini ETH product with $30.89 million. Other ETFs saw no net inflows or outflows.
This inflow reversal occurs against a backdrop of extreme market fear. The Crypto Fear & Greed Index sits at 24/100. Institutional capital has been hesitant. The seven-day outflow streak represented $312 million in cumulative withdrawals. Market structure suggests this was a classic liquidity grab below key psychological levels. The $2,800 level acted as a magnet for stop-loss orders. Related developments include Bitmine's $88.2M ETH withdrawal and Upbit's VASP license renewal amid extreme fear.
TraderT data shows precise allocation. Grayscale's ETHE absorbed $53.7 million. Their Mini ETH product captured $30.89 million. Other ETFs remained neutral. No secondary products registered flows. The timing is critical. December 22 marked the eighth trading day of the month. Previous seven days saw consistent outflows averaging $44.57 million daily. This single day's inflow represents 189% of the previous day's outflow. Market analysts attribute this to institutional rebalancing ahead of quarter-end.
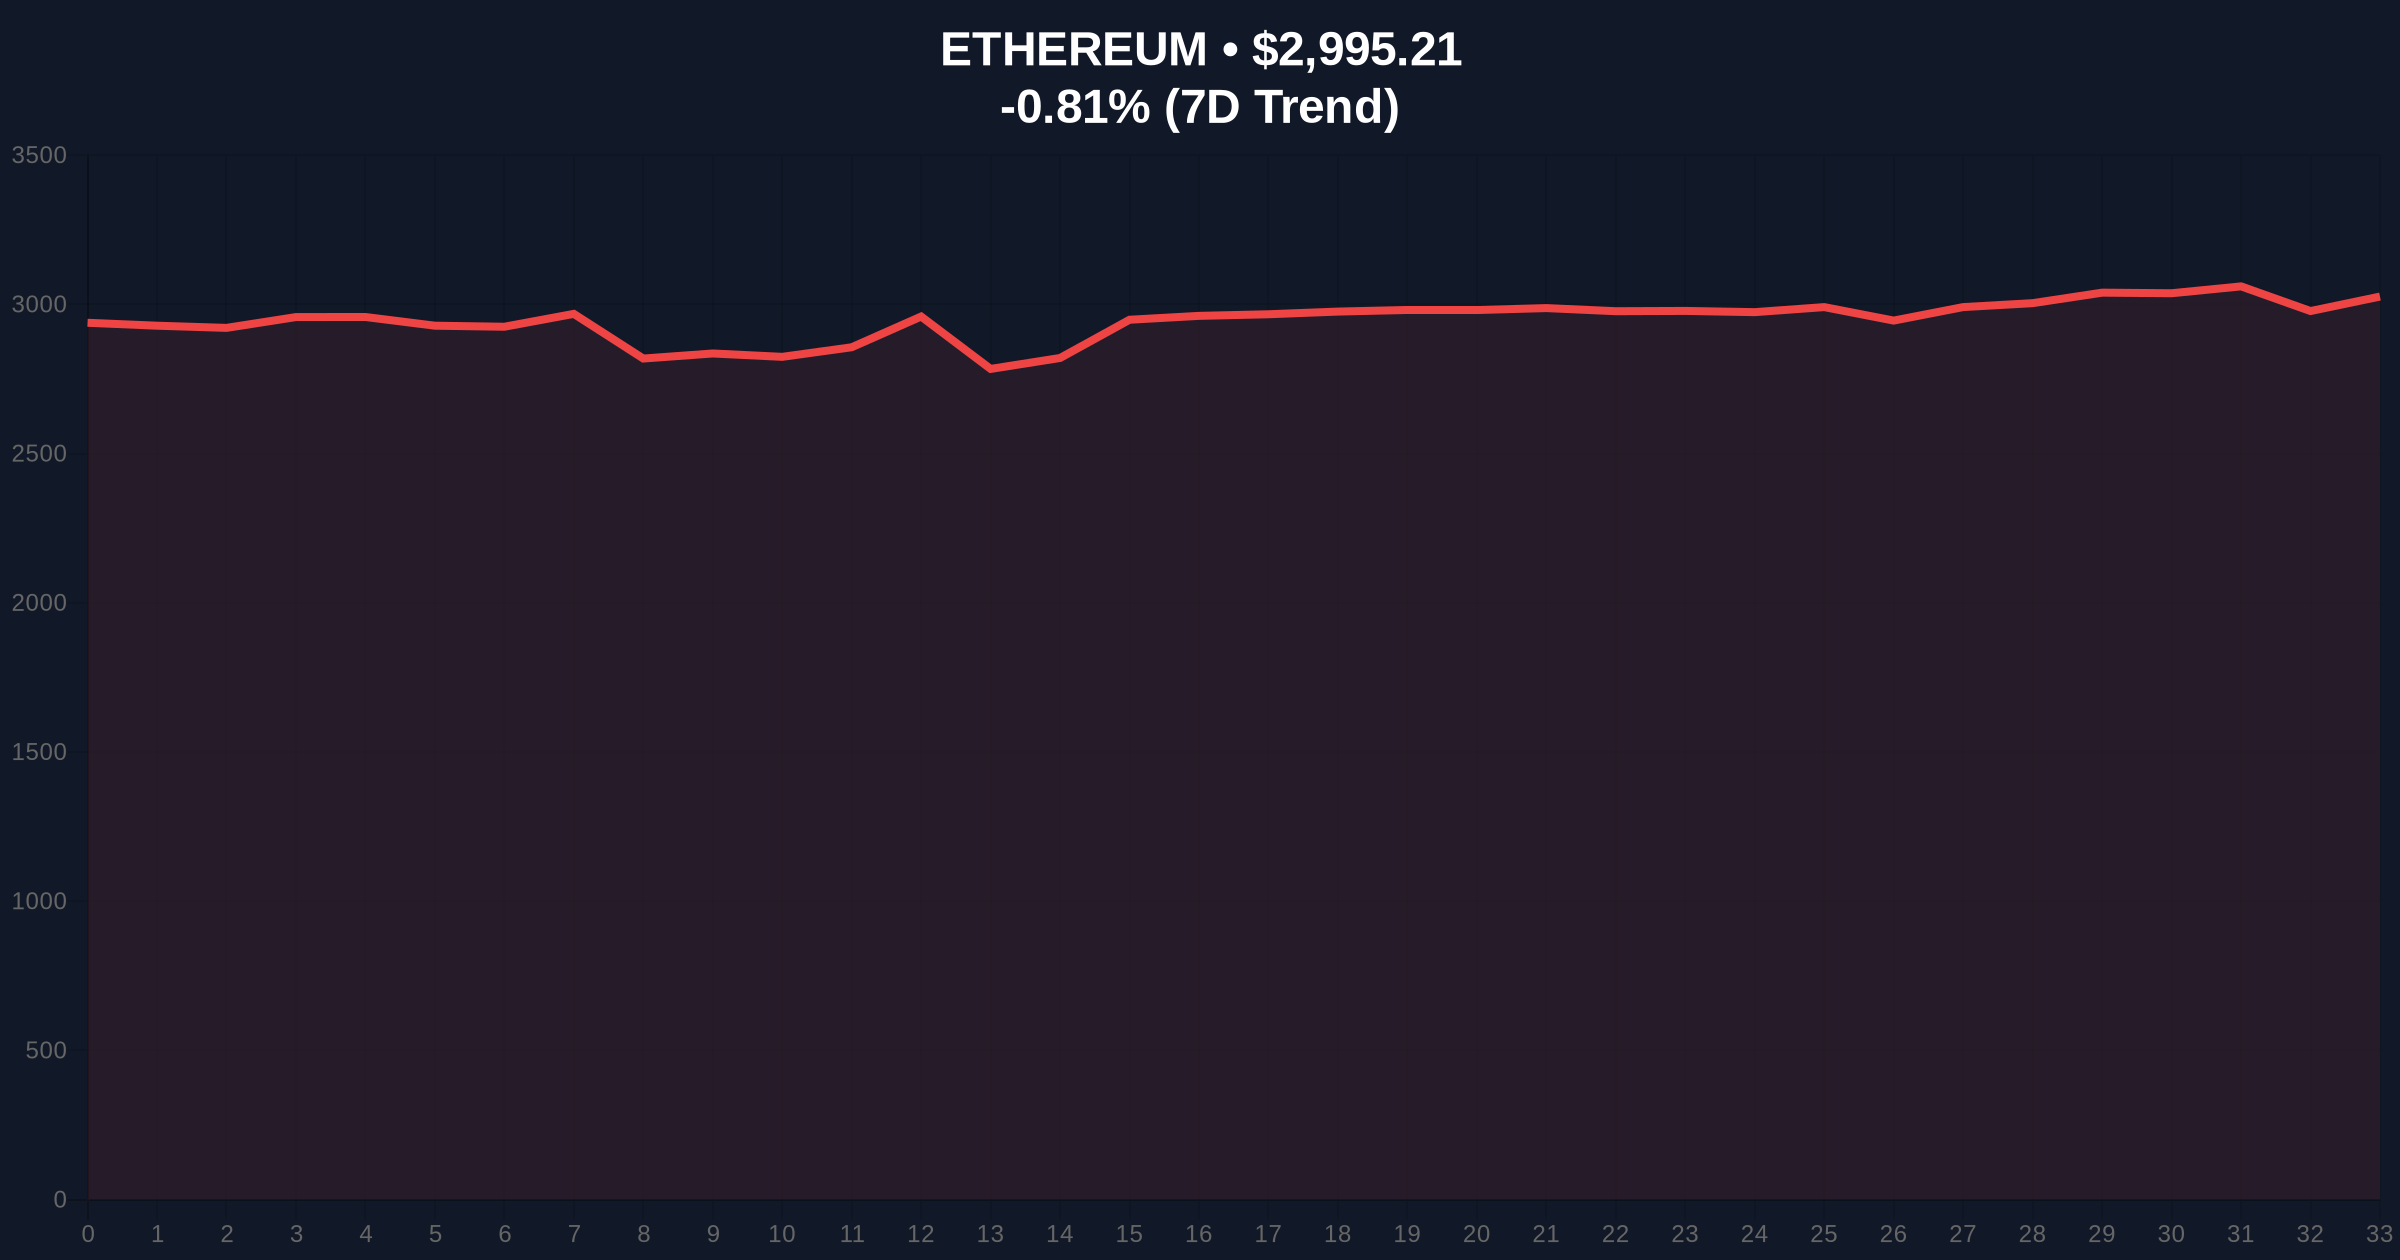
Ethereum currently trades at $2,992.65, down 0.90% in 24 hours. The 200-day moving average sits at $2,850. RSI reads 42, indicating neutral momentum. Volume profile shows accumulation between $2,800 and $3,000. A Fair Value Gap (FVG) exists between $3,050 and $3,150. This represents unfinished business from the December 18 sell-off. Bullish invalidation level: $2,750. Break below suggests continuation of bearish structure. Bearish invalidation level: $3,200. Break above confirms reversal and targets $3,500 resistance. The Fibonacci 0.618 retracement from the 2024 high sits at $2,820, providing technical confluence.
| Metric | Value |
|---|---|
| Net ETF Inflow (Dec 22) | $84.59M |
| Grayscale ETHE Inflow | $53.7M |
| Grayscale Mini ETH Inflow | $30.89M |
| Current ETH Price | $2,992.65 |
| Crypto Fear & Greed Index | 24/100 (Extreme Fear) |
Institutional impact is primary. ETF flows represent smart money positioning. The reversal suggests large players see value at current levels. Retail impact is secondary but significant. ETF activity often leads spot market movements by 24-48 hours. The seven-day outflow streak created oversold conditions. This inflow represents the first sign of institutional accumulation. For the 5-year horizon, this signals potential maturation of Ethereum's institutional adoption curve. The SEC's approval of spot Ethereum ETFs in 2024 created this infrastructure. Now we see its first stress test. According to SEC.gov, regulatory clarity remains essential for sustained institutional participation.
Market analysts on X/Twitter are divided. Bulls point to the inflow as capitulation signal. "The seven-day outflow streak represented maximum pain," one analyst noted. Bears highlight the extreme fear sentiment. "One day doesn't make a trend," countered another. The consensus: watch for follow-through. If inflows continue through week's end, a broader reversal is likely. The lack of movement in other ETFs suggests selective accumulation rather than broad-based buying.
Bullish case: Inflows continue for three consecutive days. ETH breaks above $3,200 invalidation level. This fills the FVG to $3,150. Next target: $3,500 resistance. Catalysts include positive EIP-4844 implementation progress and broader market recovery. Probability: 35%.
Bearish case: Today's inflow proves isolated. Price fails at $3,050 resistance. Breaks below $2,750 invalidation level. Targets $2,600 support. Catalysts include continued extreme fear sentiment and macroeconomic pressure from potential Fed rate hikes. Probability: 45%.
Neutral case: Range-bound between $2,800 and $3,100 until new catalyst emerges. Probability: 20%.
What caused the ETF inflow reversal?Institutional rebalancing ahead of quarter-end. Value accumulation at perceived support levels.
How significant is $84.59 million in context?Represents 27% of the previous seven days' outflows. Significant as trend interruption signal.
Will this affect Ethereum's price immediately?ETF flows typically lead spot price by 24-48 hours. Watch for $3,050 breakout or $2,800 breakdown.
What's the difference between ETHE and Mini ETH?ETHE is Grayscale's flagship product. Mini ETH offers smaller denomination exposure. Both track Ethereum price.
How does this compare to Bitcoin ETF flows?Bitcoin ETFs have seen more consistent inflows. Ethereum's flows are more volatile, reflecting its younger institutional adoption curve.
Source Note: Market data and factual reporting in this article are sourced from original reports. Commentary and analysis provided by CoinMarketBuzz.

Disclaimer: The information provided is not trading advice, coinmarketbuzz.com holds no liability for any investments made based on the information provided on this page. We strongly recommend independent research and/or consultation with a qualified professional before making any investment decisions.
coinmarketbuzz.com leverages advanced AI technology to analyze market data. All content is fact-checked and reviewed by our editorial team to ensure accuracy and neutrality.