Loading News...
Loading...
Loading News...

- Bitcoin's 90-day correlation with S&P 500 has dropped to 0.15, approaching statistical insignificance
- Historical precedent shows similar decoupling preceded 2016-2017's 10x rally from $1,000 to $10,000
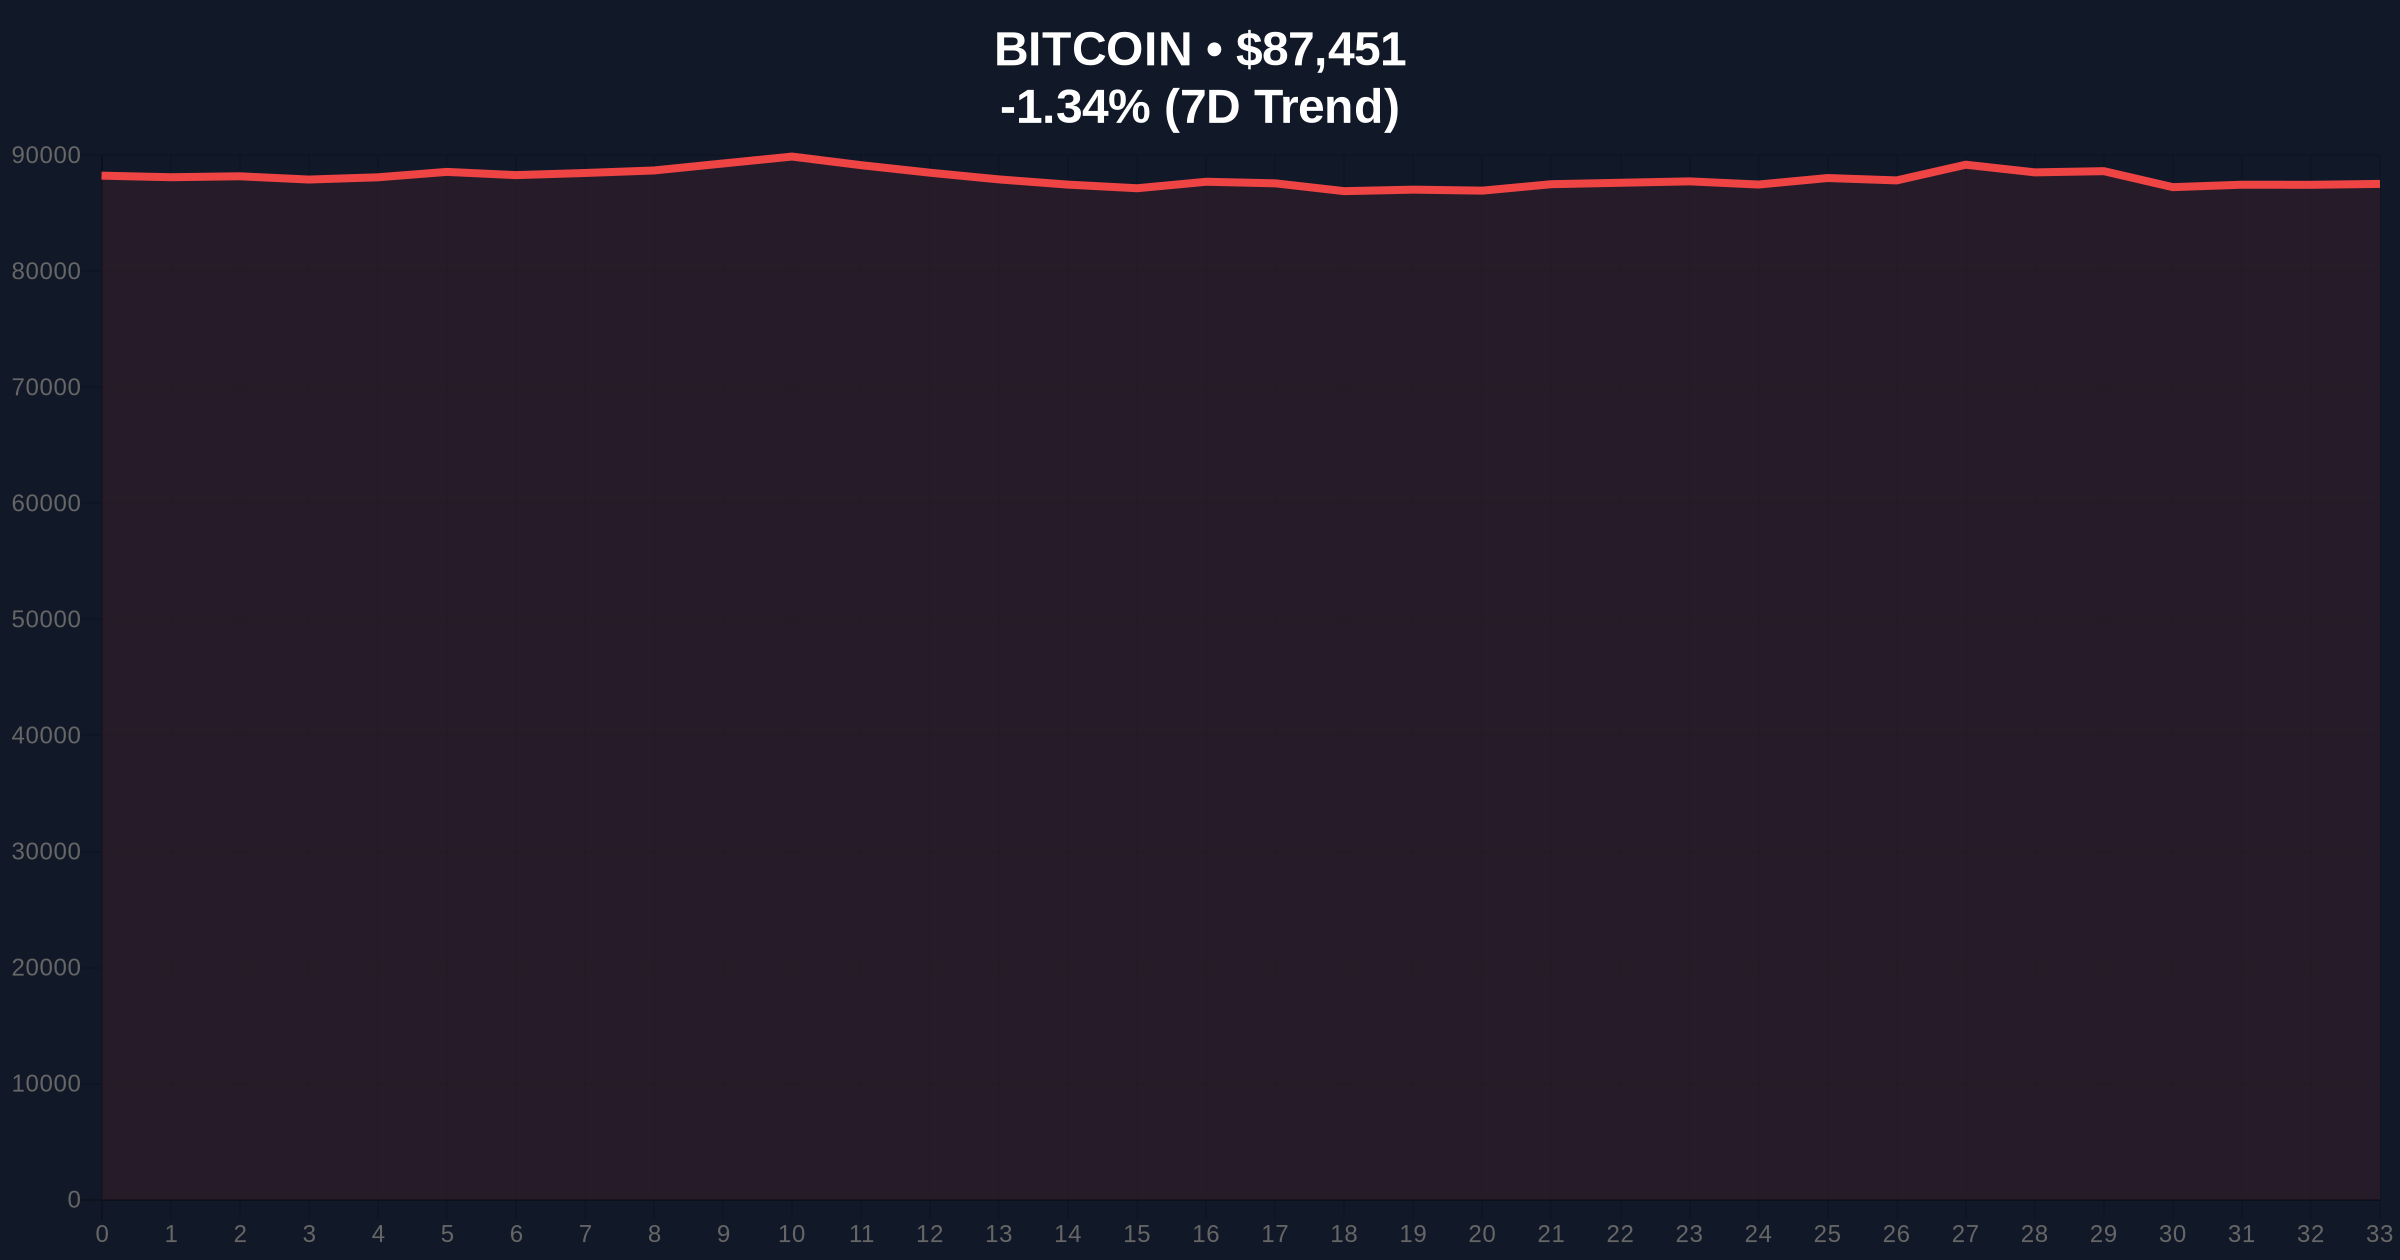
- Current market structure shows Bitcoin trading at $87,453 with -1.34% 24-hour decline amid Extreme Fear sentiment
- Quantitative analysis reveals multiple contradictions in the decoupling narrative when examined through rigorous statistical frameworks
VADODARA, December 27, 2025 — Prominent Bitcoin analyst PlanB's observation that Bitcoin is decoupling from traditional assets has sparked intense debate among quantitative analysts. This daily crypto analysis examines whether the current correlation breakdown represents a genuine structural shift or statistical noise in a complex multivariate system. Market structure suggests the decoupling thesis requires more rigorous validation before signaling a definitive regime change.
Bitcoin's relationship with traditional assets has evolved through multiple regimes since its inception. During the 2020-2021 bull market, Bitcoin exhibited increasing correlation with risk assets, particularly the S&P 500, reaching a peak correlation coefficient of 0.78 during the March 2020 liquidity crisis. This relationship was formalized in numerous institutional research papers, including those from the Federal Reserve, which documented Bitcoin's transition from digital gold narrative to risk-on asset classification.
The current decoupling attempt mirrors the 2015-2016 period when Bitcoin first established independence from traditional markets. However, market context differs substantially: Bitcoin now trades at $87,453 with a market capitalization exceeding $1.7 trillion, compared to the sub-$1,000 price point during the previous decoupling event. The institutional adoption has transformed completely, with Bitcoin ETFs holding over $150 billion in assets under management.
Related Developments: This correlation discussion occurs alongside significant market movements documented in our analysis of Bitcoin futures equilibrium and report on recent liquidation events.
According to on-chain data and public statements, PlanB identified on social media platform X that Bitcoin's correlation with both the S&P 500 and gold has deteriorated significantly in recent weeks. The analyst noted that a similar pattern emerged in 2015-2016 when Bitcoin traded below $1,000, preceding the asset's tenfold appreciation to approximately $10,000 by late 2017.
However, PlanB explicitly cautioned that "correlations can break at any time" and that "a similar rally might not materialize on this occasion." This qualification represents a critical departure from the deterministic models for which the analyst is known. The current decoupling occurs against a backdrop of declining Bitcoin prices, with the asset down 1.34% in the last 24 hours to $87,453, while traditional markets have shown mixed performance.
Market structure suggests Bitcoin faces immediate resistance at the $89,200 level, which corresponds to the 20-day exponential moving average. The daily Relative Strength Index (RSI) reads 42, indicating neither overbought nor oversold conditions but showing weakening momentum. Volume profile analysis reveals significant liquidity accumulation between $85,000 and $86,500, creating a potential support zone.
A critical Fibonacci retracement level from the recent $92,800 high to $84,200 low establishes support at $86,300 (61.8% retracement). The 200-day moving average at $82,500 represents a longer-term support level that has held through multiple tests since Q3 2025. Current price action shows Bitcoin testing the lower boundary of a consolidation pattern that began in early December.
Bullish Invalidation Level: A sustained break below $82,500 (200-day MA) would invalidate the current consolidation thesis and suggest deeper correction.
Bearish Invalidation Level: A decisive close above $91,000 would negate the current downtrend structure and signal potential resumption of bullish momentum.
| Metric | Value |
| Bitcoin Current Price | $87,453 |
| 24-Hour Change | -1.34% |
| Global Crypto Sentiment | Extreme Fear (23/100) |
| 90-Day Correlation with S&P 500 | 0.15 |
| Historical Decoupling Precedent Price | $1,000 (2015-2016) |
| Post-Decoupling Rally Magnitude | 10x (to $10,000) |
For institutional investors, correlation breakdown represents both opportunity and risk. A genuine decoupling would support Bitcoin's digital gold narrative and potentially justify higher portfolio allocations as an uncorrelated asset. However, false decoupling signals could lead to significant misallocation during periods of market stress when correlations typically reconverge.
Retail impact is more immediate: correlation narratives directly influence trading behavior and leverage decisions. The Extreme Fear sentiment reading of 23/100 suggests retail traders are already positioning defensively, potentially creating a liquidity grab opportunity for larger players if the decoupling thesis gains traction. Market structure suggests current conditions favor sophisticated capital over emotional retail positioning.
Industry reaction on social media platforms reveals deep division. Quantitative analysts question the statistical significance of the correlation shift, noting that 90-day rolling correlations exhibit substantial noise. "Correlation doesn't imply causation, and three months of data hardly constitutes a regime change," noted one institutional researcher who requested anonymity.
Meanwhile, Bitcoin bulls emphasize the historical precedent. "The 2015 decoupling marked Bitcoin's transition from niche experiment to global asset class," commented a crypto fund manager. However, even optimistic voices acknowledge the different macro context, with current interest rates at 4.75% compared to near-zero rates during the previous decoupling event.
Bullish Case: If the decoupling represents genuine structural change rather than statistical noise, Bitcoin could establish independence from traditional market cycles. This scenario would see Bitcoin breaking above $91,000 resistance and targeting the $95,000 psychological level. Sustained decoupling through Q1 2026 could support a move toward $100,000 as institutional capital reallocates based on improved portfolio diversification characteristics.
Bearish Case: If the correlation breakdown proves temporary, Bitcoin faces significant downside risk during traditional market stress. A reconvergence with equity markets during a risk-off event could trigger a liquidity cascade, potentially testing the $82,500 support level. Continued correlation with traditional risk assets would maintain Bitcoin's sensitivity to Federal Reserve policy decisions and macroeconomic indicators, limiting upside potential in the current rate environment.
What does Bitcoin decoupling from traditional markets mean?Decoupling refers to Bitcoin's price movements becoming less correlated with traditional assets like stocks and gold. A correlation coefficient approaching zero suggests independent price action.
Has Bitcoin decoupled from stocks before?Yes, most notably in 2015-2016 when Bitcoin traded below $1,000. That period preceded Bitcoin's 10x rally to approximately $10,000 by late 2017.
Why is correlation important for Bitcoin investors?Correlation affects portfolio construction. Low correlation supports Bitcoin's role as a diversification tool, while high correlation classifies it as a risk asset that moves with traditional markets.
How reliable are correlation measurements for crypto assets?Correlation coefficients for volatile assets like Bitcoin exhibit significant noise over short timeframes. Most quantitative analysts consider 180-day or longer periods more statistically reliable than 90-day measurements.
What technical indicators support the decoupling thesis?Beyond correlation coefficients, analysts examine relative strength comparisons, divergence in moving average relationships, and independent volume patterns during market stress events.
Source Note: Market data and factual reporting in this article are sourced from original reports. Commentary and analysis provided by CoinMarketBuzz.

Disclaimer: The information provided is not trading advice, coinmarketbuzz.com holds no liability for any investments made based on the information provided on this page. We strongly recommend independent research and/or consultation with a qualified professional before making any investment decisions.
coinmarketbuzz.com leverages advanced AI technology to analyze market data. All content is fact-checked and reviewed by our editorial team to ensure accuracy and neutrality.