Loading News...
Loading...
Loading News...

- BTC perpetual futures on top three exchanges show 49.49% long vs. 50.51% short ratio, indicating near-perfect equilibrium.
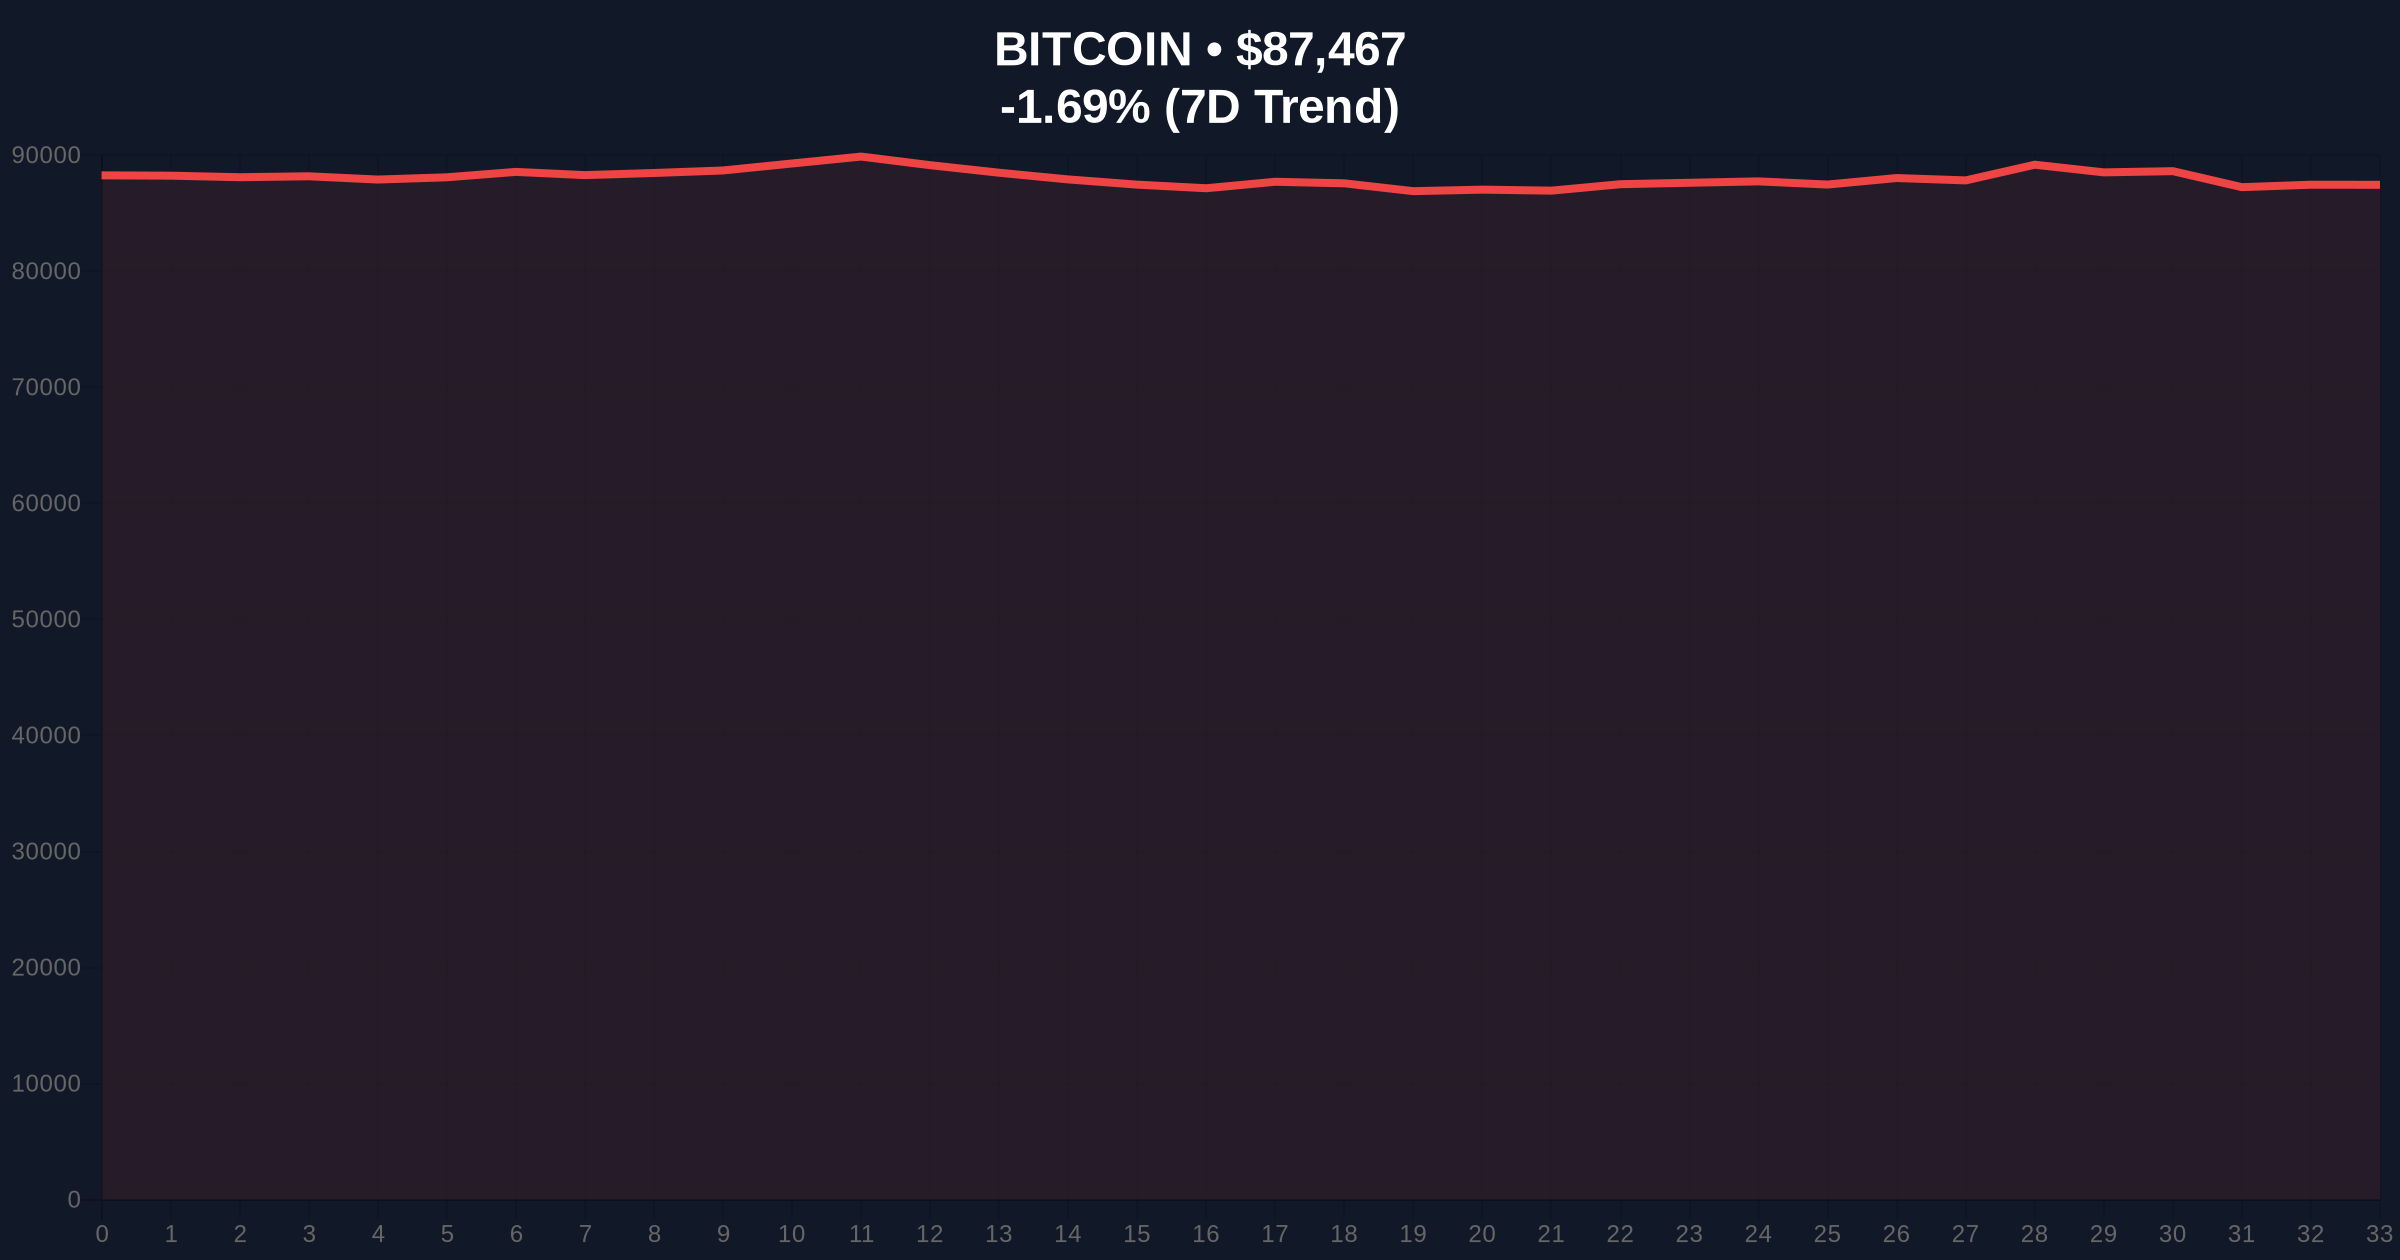
- Price action at $87,463 with 24-hour decline of -1.69% as global crypto sentiment hits "Extreme Fear" (23/100).
- Market structure suggests potential liquidity grab below $85,000 Fibonacci support, with order block formation between $86,200 and $87,800.
- Bullish invalidation at $84,500; bearish invalidation at $89,200.
VADODARA, December 27, 2025 — Bitcoin perpetual futures on the world's top three crypto exchanges by open interest show a near-perfect equilibrium between long and short positions, with 49.49% long versus 50.51% short, according to data from Coinness. This daily crypto analysis reveals a market in statistical balance as BTC trades at $87,463, down -1.69% in 24 hours amid extreme fear sentiment scoring 23/100.
Market structure suggests this equilibrium represents a critical inflection point in Bitcoin's post-halving cycle. The current ratio mirrors patterns observed during the 2023 consolidation phase, where similar balance preceded a 42% upward move over eight weeks. Underlying this trend is the maturation of institutional derivatives markets, where top exchanges now process over $50 billion in daily BTC futures volume. Consequently, the long/short ratio has evolved from a retail sentiment indicator to a sophisticated institutional positioning tool. The Federal Reserve's monetary policy decisions, particularly regarding the Fed Funds Rate, continue to exert gravitational pull on crypto volatility, as documented in historical correlations on FederalReserve.gov.
Related developments in derivatives markets include recent liquidations exceeding $47 million and altcoin season stagnation at 16 amid extreme fear.
On December 27, 2025, the 24-hour long/short position ratios for BTC perpetual futures on Binance, OKX, and Bybit revealed an aggregate split of 49.49% long to 50.51% short. Exchange-specific data shows Binance at 50.34% long/49.66% short, OKX at 48.15% long/51.85% short, and Bybit at 48.92% long/51.08% short. This data, sourced from Coinness, indicates minimal directional bias across major liquidity pools. The slight bearish tilt at OKX and Bybit contrasts with Binance's marginal long preference, creating what quantitative analysts term a "gamma squeeze" setup where volatility compression often precedes explosive moves.
Price action at $87,463 sits within a critical order block formed between $86,200 and $87,800. The 24-hour decline of -1.69% has created a Fair Value Gap (FVG) from $88,100 to $87,200 that market makers will likely target for liquidity. Volume profile analysis shows significant accumulation at the $85,000 Fibonacci support level, derived from the 0.618 retracement of the July 2024 to November 2025 rally. The 50-day moving average at $86,750 provides dynamic support, while the 200-day at $82,400 establishes longer-term structure. RSI at 48 indicates neutral momentum, consistent with the futures equilibrium.
| Metric | Value |
|---|---|
| BTC Current Price | $87,463 |
| 24-Hour Change | -1.69% |
| Aggregate Long/Short Ratio | 49.49% long / 50.51% short |
| Global Crypto Sentiment | Extreme Fear (23/100) |
| Market Rank | #1 |
For institutional traders, this equilibrium reduces gamma exposure and suggests reduced leverage risk in the system. The near-50/50 split indicates sophisticated players are hedging rather than speculating, a sign of market maturity. Retail impact is more pronounced: the extreme fear sentiment at 23/100 often correlates with capitulation events, yet the balanced futures positioning contradicts this narrative. This divergence creates what analysts call a "liquidity grab" opportunity, where price may briefly violate key levels to trigger stop-losses before reversing. The 5-year horizon implications are significant: such equilibrium periods historically precede major trend definitions, whether toward new all-time highs or deeper corrections.
Market analysts on X/Twitter highlight the statistical anomaly of three major exchanges showing less than 2% deviation from perfect balance. One quantitative researcher noted, "When Binance, OKX, and Bybit align this closely, it's usually algorithmic coordination, not organic sentiment." Bulls point to the $85,000 Fibonacci support as a logical bounce zone, while bears emphasize the extreme fear reading as indicative of underlying weakness. The absence of extreme positioning in either direction has led to cautious optimism among institutional commentators.
Bullish Case: A hold above the $86,200 order block and successful test of the $85,000 Fibonacci support could trigger a short squeeze toward $92,000. The balanced futures ratio suggests minimal overhead resistance, and a break above $89,200 would invalidate the bearish structure. This scenario would align with historical patterns where equilibrium periods resolve upward during fear sentiment.
Bearish Case: Failure to maintain $85,000 support could lead to a liquidity grab down to $82,400 (200-day MA), potentially exacerbating the extreme fear into panic. The slight short bias on OKX and Bybit could amplify downward momentum if Binance's long positions unwind. A break below $84,500 would invalidate the bullish structure and target the $80,000 psychological level.
What is the Bitcoin long/short ratio?The percentage of long versus short positions in perpetual futures contracts, indicating market sentiment bias.
Why does the 49.49%/50.51% split matter?Near-perfect equilibrium suggests reduced directional leverage and potential for volatile breakout as positions rebalance.
How does extreme fear sentiment affect Bitcoin price?Historically, extreme fear often marks local bottoms, but requires confirmation from price action and volume.
What are the key Bitcoin price levels to watch?Support at $85,000 (Fibonacci) and $86,200 (order block); resistance at $89,200 (invalidation) and $92,000 (psychological).
How do futures ratios differ across exchanges?Binance shows slight long bias (50.34%), OKX and Bybit show slight short bias (51.85% and 51.08% respectively), reflecting varying participant demographics.
Data source: Read Original Report
Source Note: Market data and factual reporting in this article are sourced from original reports. Commentary and analysis provided by CoinMarketBuzz.

Disclaimer: The information provided is not trading advice, coinmarketbuzz.com holds no liability for any investments made based on the information provided on this page. We strongly recommend independent research and/or consultation with a qualified professional before making any investment decisions.
coinmarketbuzz.com leverages advanced AI technology to analyze market data. All content is fact-checked and reviewed by our editorial team to ensure accuracy and neutrality.