Loading News...
Loading...
Loading News...

- Bitcoin long positions accounted for 91.39% of $47.32 million in 24-hour liquidations, signaling a sharp correction in leveraged bullish bets.
- Ethereum followed with $21.18 million in liquidations, 74.9% from longs, while ZEC saw $5.52 million dominated by shorts at 94.88%.
- Market structure suggests a liquidity grab below key support levels, with the Global Crypto Fear & Greed Index at 23/100 indicating extreme fear.
- Technical analysis identifies critical invalidation levels at $85,200 (bearish) and $89,500 (bullish), with RSI at 42 showing neutral momentum.
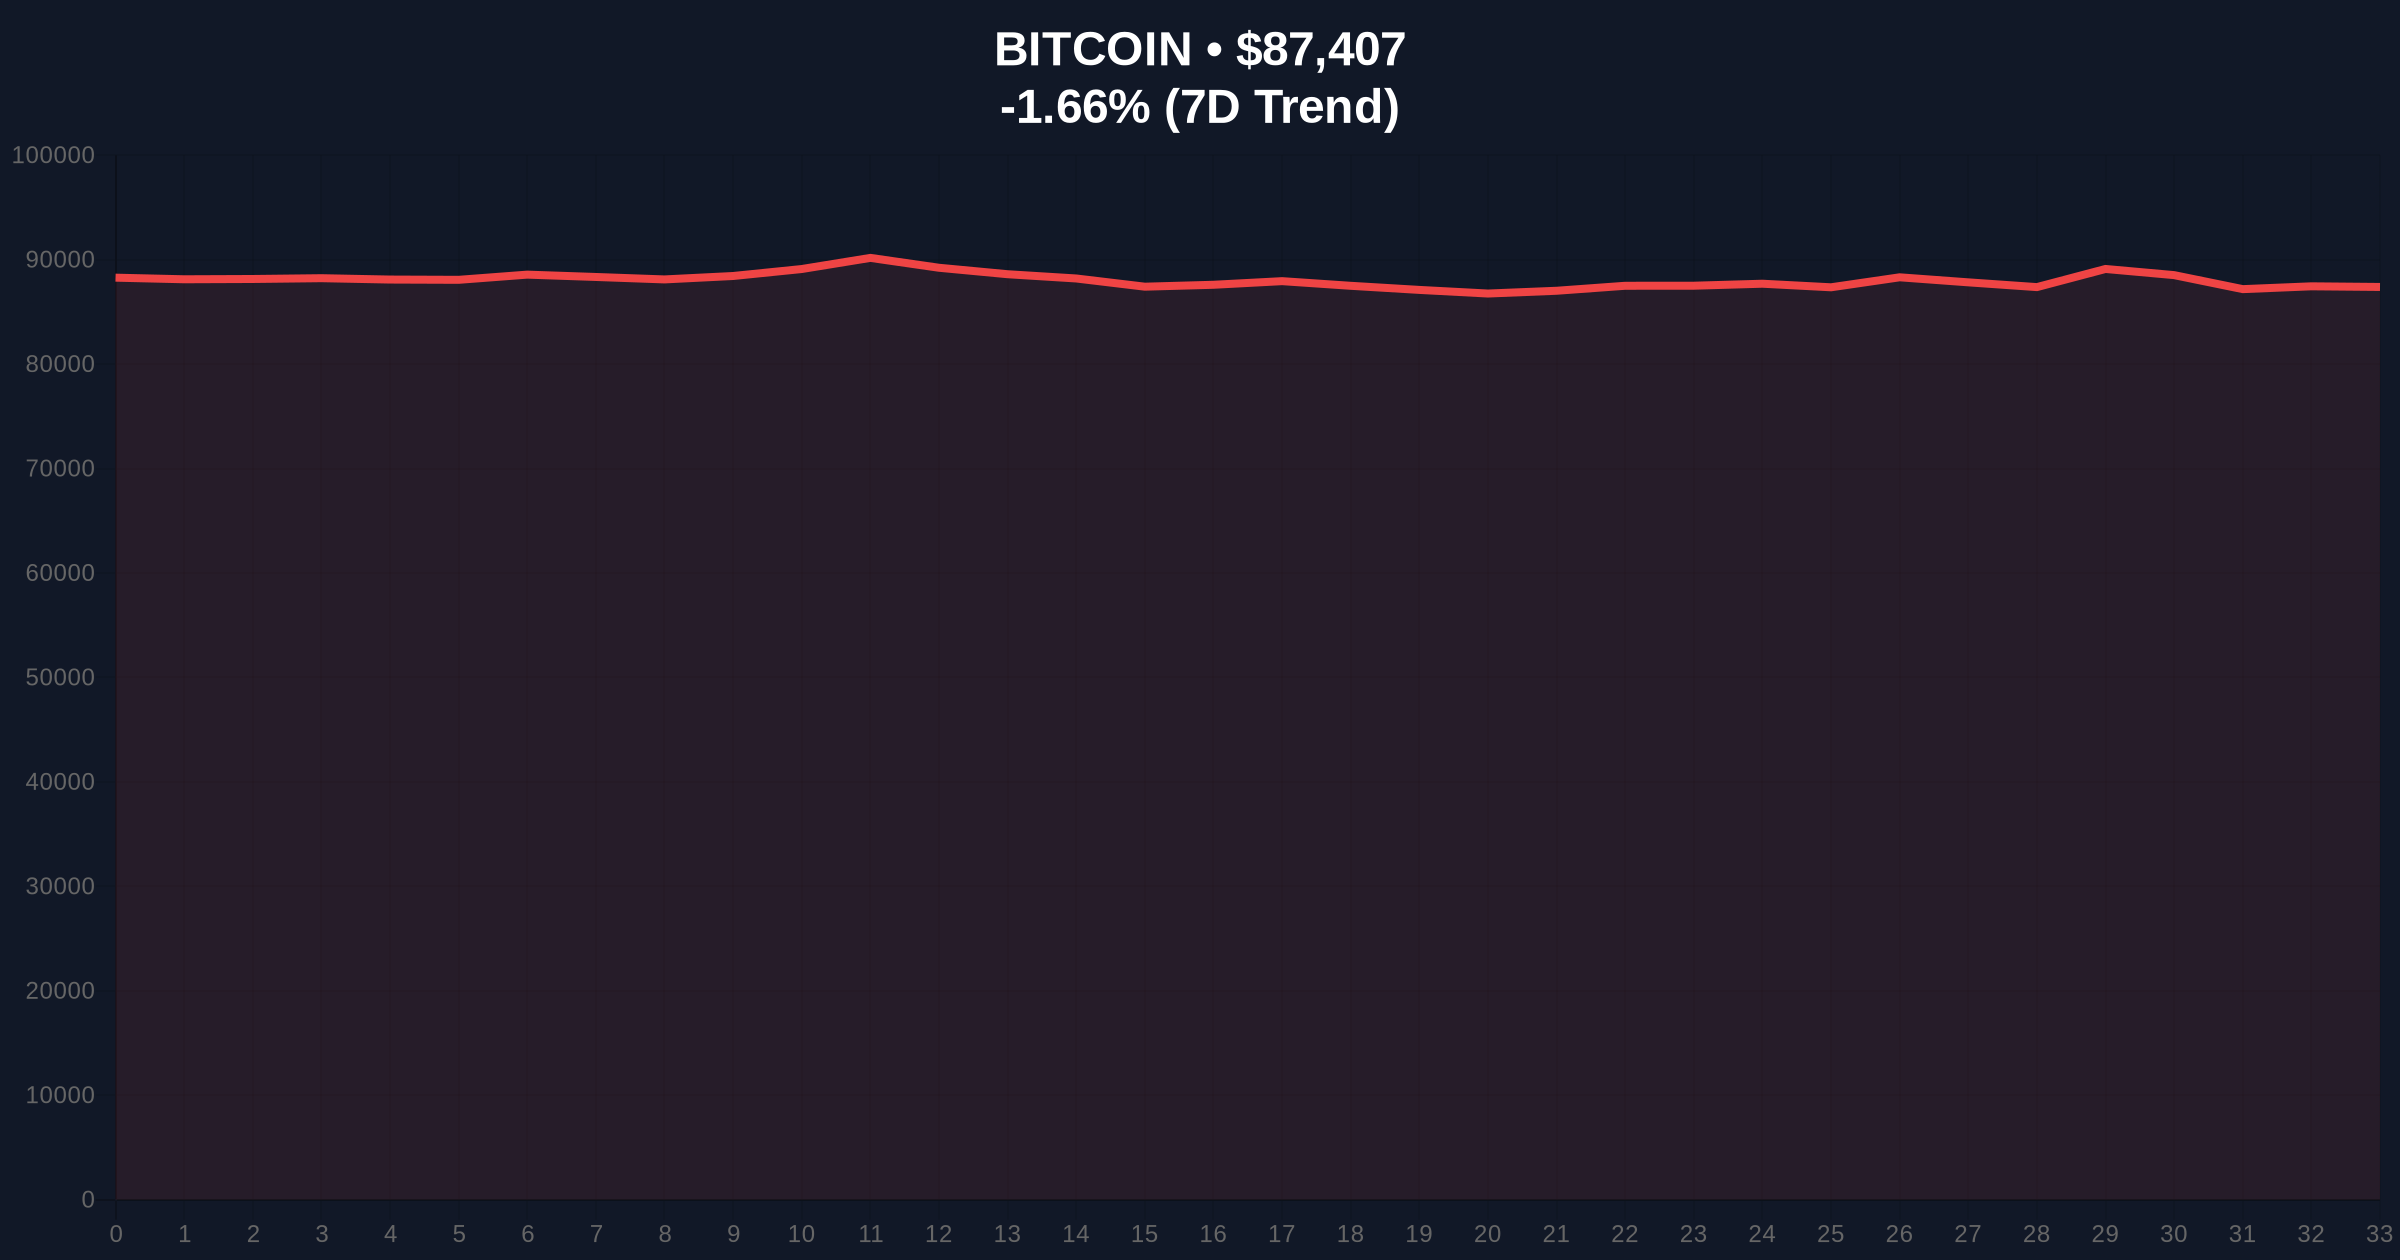
VADODARA, December 27, 2025 — In a stark display of market deleveraging, Bitcoin long positions comprised 91.39% of $47.32 million in 24-hour liquidations across perpetual futures markets, according to data from Coinness. This daily crypto analysis reveals a pronounced skew toward long liquidations for major assets, with Ethereum seeing $21.18 million (74.9% longs) and ZEC experiencing $5.52 million (94.88% shorts). The liquidation cascade occurred as Bitcoin price dipped to $87,412, down 1.65% on the day, amid a Global Crypto Sentiment score of 23/100 signaling extreme fear.
This liquidation event mirrors patterns observed during the 2021 bull market correction, where excessive leverage led to violent deleveraging episodes. Market structure suggests that perpetual futures markets have become increasingly saturated with long positions, creating a fragile equilibrium. Underlying this trend is the proliferation of high-leverage trading products, which amplify volatility during price dislocations. The current extreme fear sentiment, as measured by the Fear & Greed Index, indicates a capitulation phase often preceding market reversals. Related developments include recent analyses on extreme fear sentiment and altcoin season stagnation, highlighting broader market stress.
Over the past 24 hours, liquidations in the cryptocurrency perpetual futures market were heavily skewed toward long positions for major assets. According to on-chain data from Coinness, BTC saw $47.32 million in liquidations, with longs making up 91.39% of the total. Similarly, ETH liquidations reached $21.18 million, of which 74.9% were long positions. In contrast, ZEC liquidations totaled $5.52 million, dominated by short positions at 94.88%. This divergence suggests sector-specific dynamics, with Bitcoin and Ethereum experiencing coordinated selling pressure while privacy coins like ZEC faced short squeezes. The liquidation volume represents a significant unwind of leveraged positions, particularly among retail traders using high-margin products.
Bitcoin price action reveals a clear liquidity grab below the $88,000 support level, which previously acted as a consolidation zone. The move created a Fair Value Gap (FVG) between $86,500 and $87,800, likely to be filled in subsequent sessions. Volume Profile analysis shows increased selling pressure at $89,000, forming a resistance order block. The Relative Strength Index (RSI) sits at 42, indicating neutral momentum with a slight bearish bias. Moving averages provide critical context: the 50-day EMA at $85,200 serves as dynamic support, while the 200-day SMA at $82,000 aligns with the 0.618 Fibonacci retracement level from the recent rally. Market structure suggests that a break below $85,200 would invalidate the bullish thesis, potentially triggering further liquidations. Conversely, reclaiming $89,500 would negate the bearish scenario and target the $92,000 resistance zone.
| Metric | Value |
|---|---|
| Bitcoin 24h Liquidations | $47.32M |
| BTC Longs Percentage | 91.39% |
| Ethereum 24h Liquidations | $21.18M |
| Global Fear & Greed Index | 23/100 (Extreme Fear) |
| Bitcoin Current Price | $87,412 |
For institutional investors, this liquidation event serves as a risk management alert, highlighting the perils of over-leverage in derivatives markets. The skew toward long liquidations suggests that bullish sentiment had become overly extended, requiring a correction to restore equilibrium. Retail traders face immediate capital destruction, with many forced exits exacerbating downward momentum. In the 5-year horizon, such events underscore the need for robust regulatory frameworks for crypto derivatives, as outlined by authorities like the SEC. The market's ability to absorb these liquidations without cascading failures will test the resilience of exchange infrastructure and liquidity providers.
Market analysts on X/Twitter have characterized the move as a "necessary flush" of weak longs. One quant trader noted, "The 91% long liquidation ratio in BTC is classic capitulation—often a precursor to a relief rally." Bulls argue that the extreme fear reading presents a contrarian buying opportunity, while bears warn of further downside if macroeconomic headwinds persist. The divergence in ZEC liquidations has sparked debate about sector rotation, with some suggesting capital may flow into privacy coins as Bitcoin stabilizes.
Bullish Case: If Bitcoin holds the $85,200 support (50-day EMA), the liquidation flush could mark a local bottom. A rebound toward $92,000 is plausible, fueled by short covering and renewed institutional accumulation. The Bullish Invalidation Level is $85,200; a break below would signal continued distribution.
Bearish Case: Failure to reclaim $89,500 resistance may lead to a test of the $82,000 Fibonacci support. Additional long liquidations could trigger a gamma squeeze in options markets, exacerbating volatility. The Bearish Invalidation Level is $89,500; a close above would invalidate the downtrend and target higher highs.
What caused the Bitcoin long liquidations? A combination of price decline below key support levels and over-leveraged long positions triggered margin calls, leading to forced liquidations.
How does this affect Bitcoin price? Liquidations create selling pressure in the short term but can lead to volatility compression and potential reversals once weak hands are cleared.
What is the significance of 91% long liquidations? Such a high percentage indicates extreme bullish positioning that became unsustainable, often marking sentiment extremes.
Should I buy after liquidations? Historical patterns suggest liquidation events can present buying opportunities, but market structure and invalidation levels must be monitored.
How does this compare to past liquidation events? Similar skews occurred in 2021 and 2023, leading to sharp rebounds, but macroeconomic context differs in 2025.
Source Note: Market data and factual reporting in this article are sourced from original reports. Commentary and analysis provided by CoinMarketBuzz.

Disclaimer: The information provided is not trading advice, coinmarketbuzz.com holds no liability for any investments made based on the information provided on this page. We strongly recommend independent research and/or consultation with a qualified professional before making any investment decisions.
coinmarketbuzz.com leverages advanced AI technology to analyze market data. All content is fact-checked and reviewed by our editorial team to ensure accuracy and neutrality.