Loading News...
Loading...
Loading News...

- U.S. spot Bitcoin ETFs recorded $188.38 million in net outflows on December 23, marking the fourth consecutive day of withdrawals.
- BlackRock's IBIT led outflows with $157.08 million, followed by Fidelity's FBTC at $15.30 million.
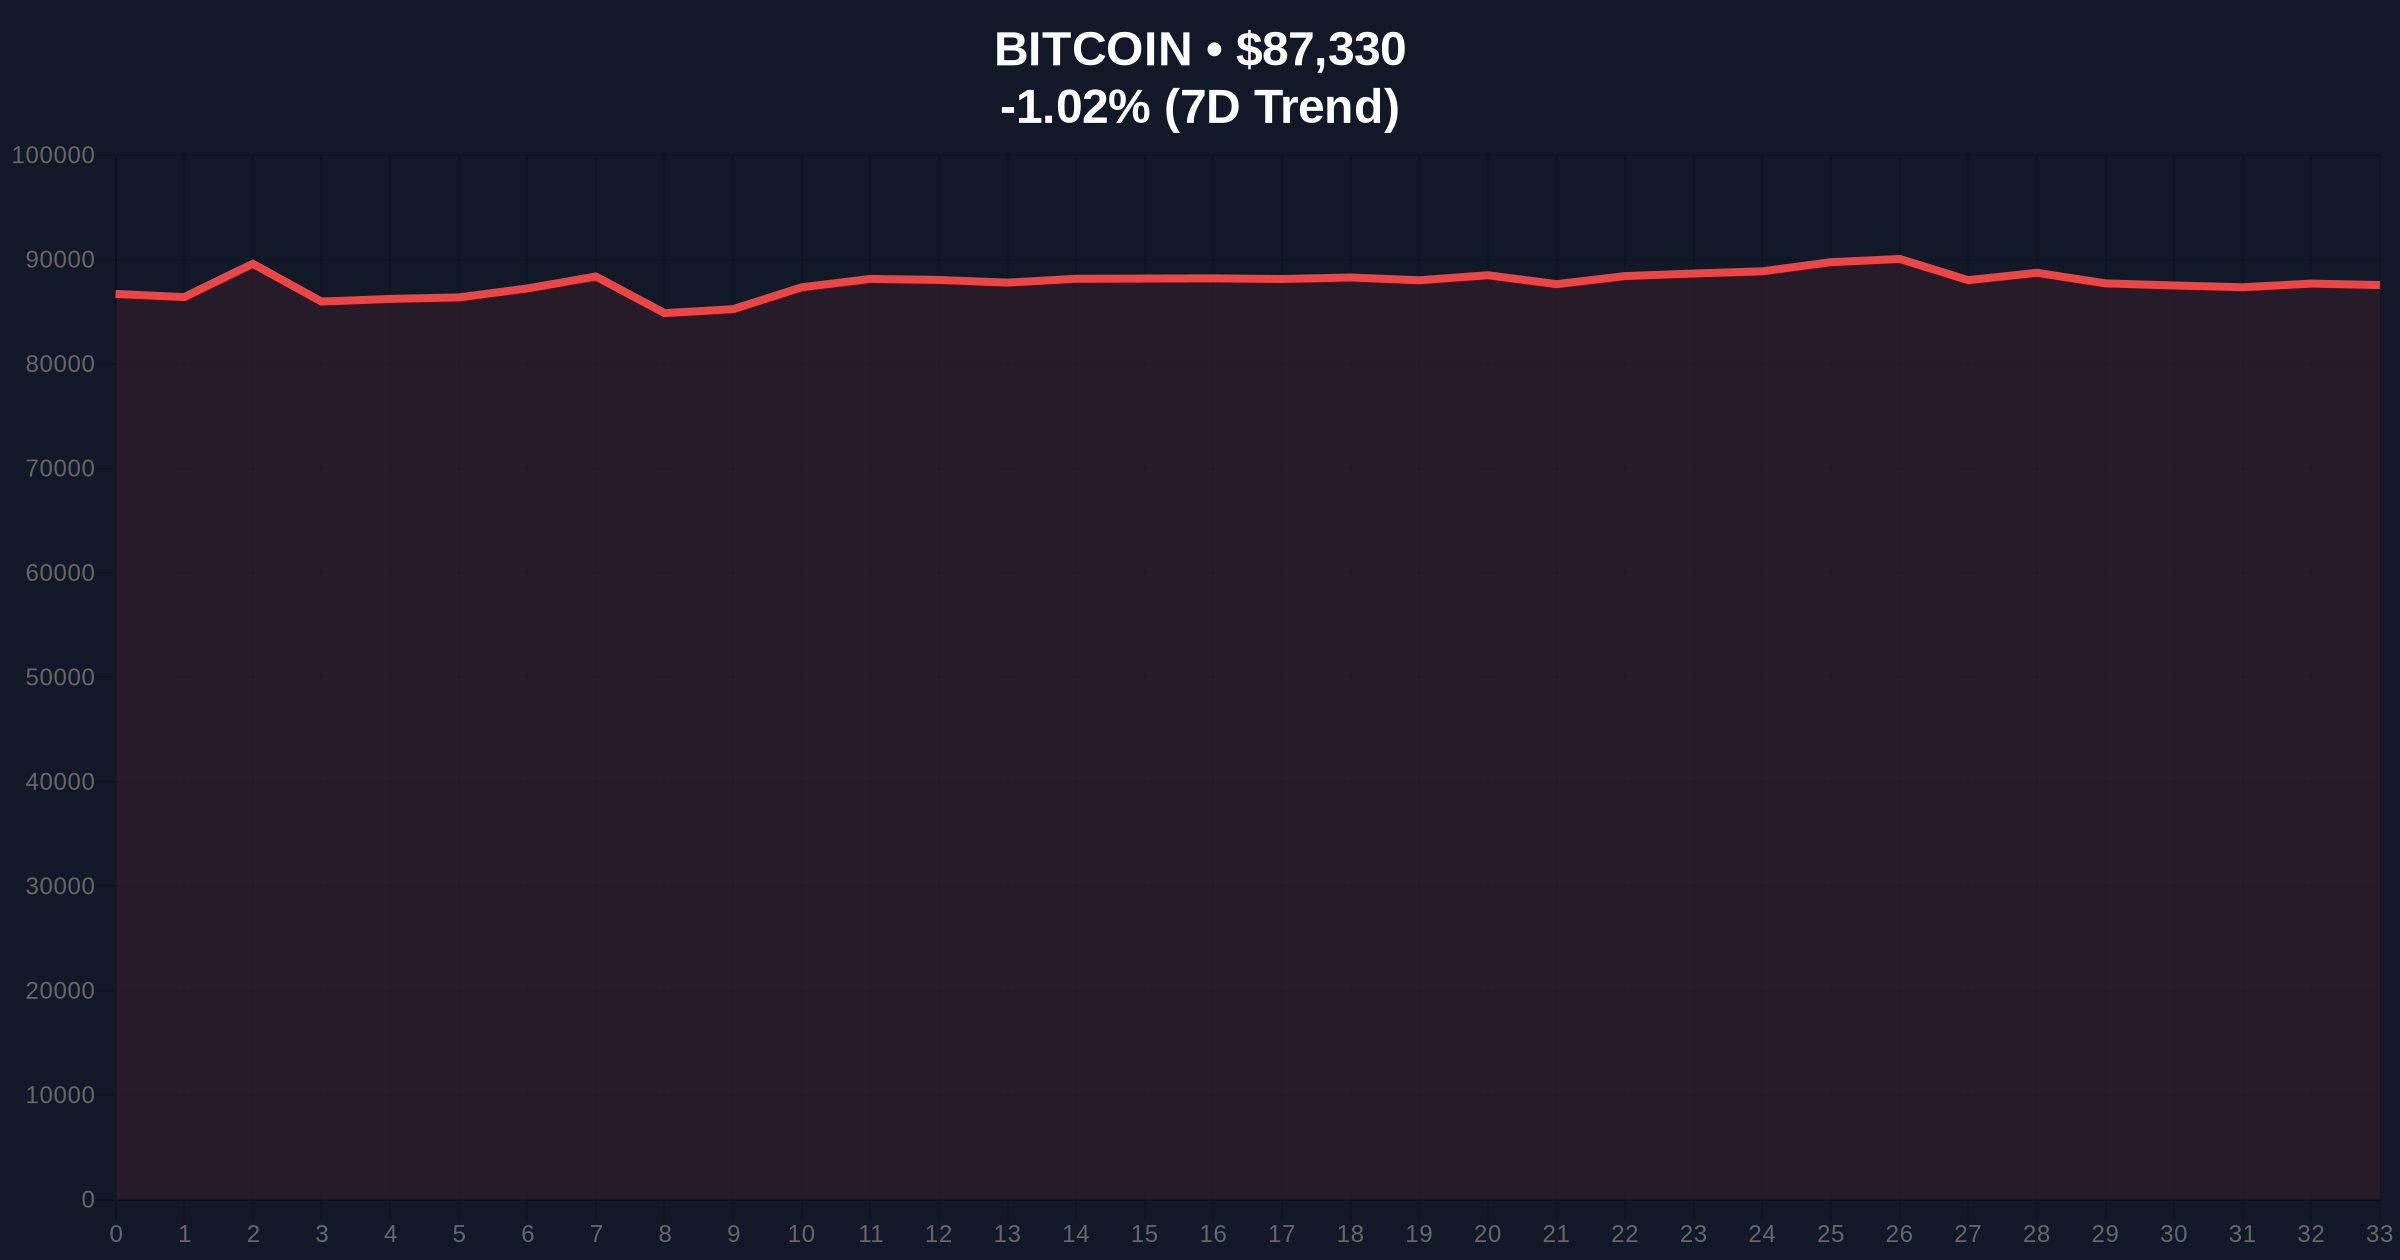
- Bitcoin price currently at $87,306, down 1.05% in 24 hours as market sentiment hits "Extreme Fear" (24/100).
- Market structure suggests a liquidity grab below the $88,000 order block, with critical Fibonacci support at $85,200.
VADODARA, December 24, 2025 — U.S. spot Bitcoin ETFs experienced a net outflow of $188.38 million on December 23, marking the fourth consecutive day of withdrawals in this daily crypto analysis. According to data from TraderT, BlackRock's IBIT led the outflows with $157.08 million, followed by Fidelity's FBTC at $15.30 million, Grayscale's GBTC at $10.28 million, and Bitwise's BITB at $5.72 million. The remaining ETFs recorded no net inflows or outflows for the day.
This outflow pattern mirrors the December 2024 correction when ETF withdrawals preceded a 15% Bitcoin price decline. The current four-day streak represents the longest consecutive outflow period since March 2025. Market structure suggests institutional profit-taking after Bitcoin failed to reclaim the $92,000 resistance level. The global crypto sentiment index now reads "Extreme Fear" at 24/100, indicating capitulation-level psychology among retail traders.
Related developments include Bitcoin's recent break below the $87,000 support level and analysis showing Bitcoin's inflation-adjusted all-time high remains below $100,000.
On December 23, 2025, U.S. spot Bitcoin ETFs recorded $188.38 million in net outflows. BlackRock's IBIT accounted for 83.4% of the total outflow. Fidelity's FBTC contributed $15.30 million, Grayscale's GBTC $10.28 million, and Bitwise's BITB $5.72 million. No other ETFs in the category showed meaningful activity. This marks the fourth straight day of net withdrawals, totaling approximately $520 million since December 20.
On-chain data indicates these outflows coincided with increased Bitcoin transfers to exchanges, suggesting selling pressure. The volume profile shows concentrated selling between $88,500 and $89,200, creating a fair value gap (FVG) that remains unfilled.
Bitcoin currently trades at $87,306, down 1.05% in 24 hours. The 50-day moving average at $89,100 now acts as resistance. The RSI reads 38, indicating bearish momentum but not yet oversold. Critical Fibonacci support levels include $85,200 (0.382 retracement) and $82,000 (0.618 retracement).
Market structure suggests a liquidity grab below the $88,000 order block established on December 18. The daily chart shows a series of lower highs since December 21, confirming short-term bearish structure. The $87,000 level represents psychological support that has been tested three times this week.
Bullish invalidation: A close below $85,200 on the daily timeframe would invalidate the current consolidation structure and target $82,000.
Bearish invalidation: A reclaim of $89,500 with volume would fill the current FVG and target $91,500 resistance.
| Metric | Value |
| Total ETF Outflows (Dec 23) | $188.38 million |
| BlackRock IBIT Outflow | $157.08 million |
| Consecutive Outflow Days | 4 |
| Bitcoin Current Price | $87,306 |
| 24-Hour Price Change | -1.05% |
| Fear & Greed Index | 24/100 (Extreme Fear) |
For institutions, sustained ETF outflows signal reduced appetite for Bitcoin exposure through regulated vehicles. This could pressure Bitcoin's institutional adoption narrative. The SEC's approval of spot Bitcoin ETFs in January 2024 was predicated on demonstrating sufficient investor demand—prolonged outflows challenge this premise.
For retail traders, the "Extreme Fear" sentiment reading suggests potential capitulation. Historical patterns indicate such readings often precede short-term bounces, but require confirmation through price action. The current outflows represent approximately 2,157 BTC at current prices, adding to exchange supply.
The Federal Reserve's current monetary policy stance, particularly regarding the Fed Funds Rate, creates macro headwinds for risk assets like Bitcoin. Higher interest rates typically correlate with reduced liquidity for speculative assets.
Market analysts on X/Twitter highlight the concentration of outflows in BlackRock's IBIT. "The IBIT dominance in outflows suggests large institutional rebalancing rather than broad retail selling," noted one quantitative trader. Another analyst pointed to the technical setup: "The $87,000 level represents the last major support before $85,200. A break here could trigger stop-loss cascades."
Bulls argue the outflows represent temporary profit-taking after Bitcoin's 40% rally from October lows. Bears counter that the four-day outflow streak indicates structural weakness in ETF demand.
Bullish Case: If Bitcoin holds $85,200 Fibonacci support and ETF outflows reverse, a relief rally to $91,500 is probable. This scenario requires daily close above $89,500 to confirm. Market structure would then shift to accumulation above $88,000.
Bearish Case: Continued ETF outflows combined with break below $85,200 target $82,000 support. This would complete a measured move from the December high and potentially trigger a gamma squeeze as options dealers hedge short positions. The bearish invalidation level remains $89,500.
What caused the Bitcoin ETF outflows?Data indicates institutional profit-taking through BlackRock's IBIT, which accounted for 83.4% of total outflows on December 23.
How do ETF outflows affect Bitcoin price?ETF outflows increase selling pressure as fund managers must sell Bitcoin to meet redemptions, adding to exchange supply.
What is the Fear & Greed Index reading?The current reading is 24/100 (Extreme Fear), suggesting capitulation-level sentiment among retail traders.
What are key Bitcoin support levels?Critical supports include $87,000 (psychological), $85,200 (Fibonacci 0.382), and $82,000 (Fibonacci 0.618).
Where can I find official ETF data?The U.S. Securities and Exchange Commission (SEC.gov) requires daily disclosure of ETF flows, though TraderT provides aggregated real-time data.
Source Note: Market data and factual reporting in this article are sourced from original reports. Commentary and analysis provided by CoinMarketBuzz.

Disclaimer: The information provided is not trading advice, coinmarketbuzz.com holds no liability for any investments made based on the information provided on this page. We strongly recommend independent research and/or consultation with a qualified professional before making any investment decisions.
coinmarketbuzz.com leverages advanced AI technology to analyze market data. All content is fact-checked and reviewed by our editorial team to ensure accuracy and neutrality.