Loading News...
Loading...
Loading News...

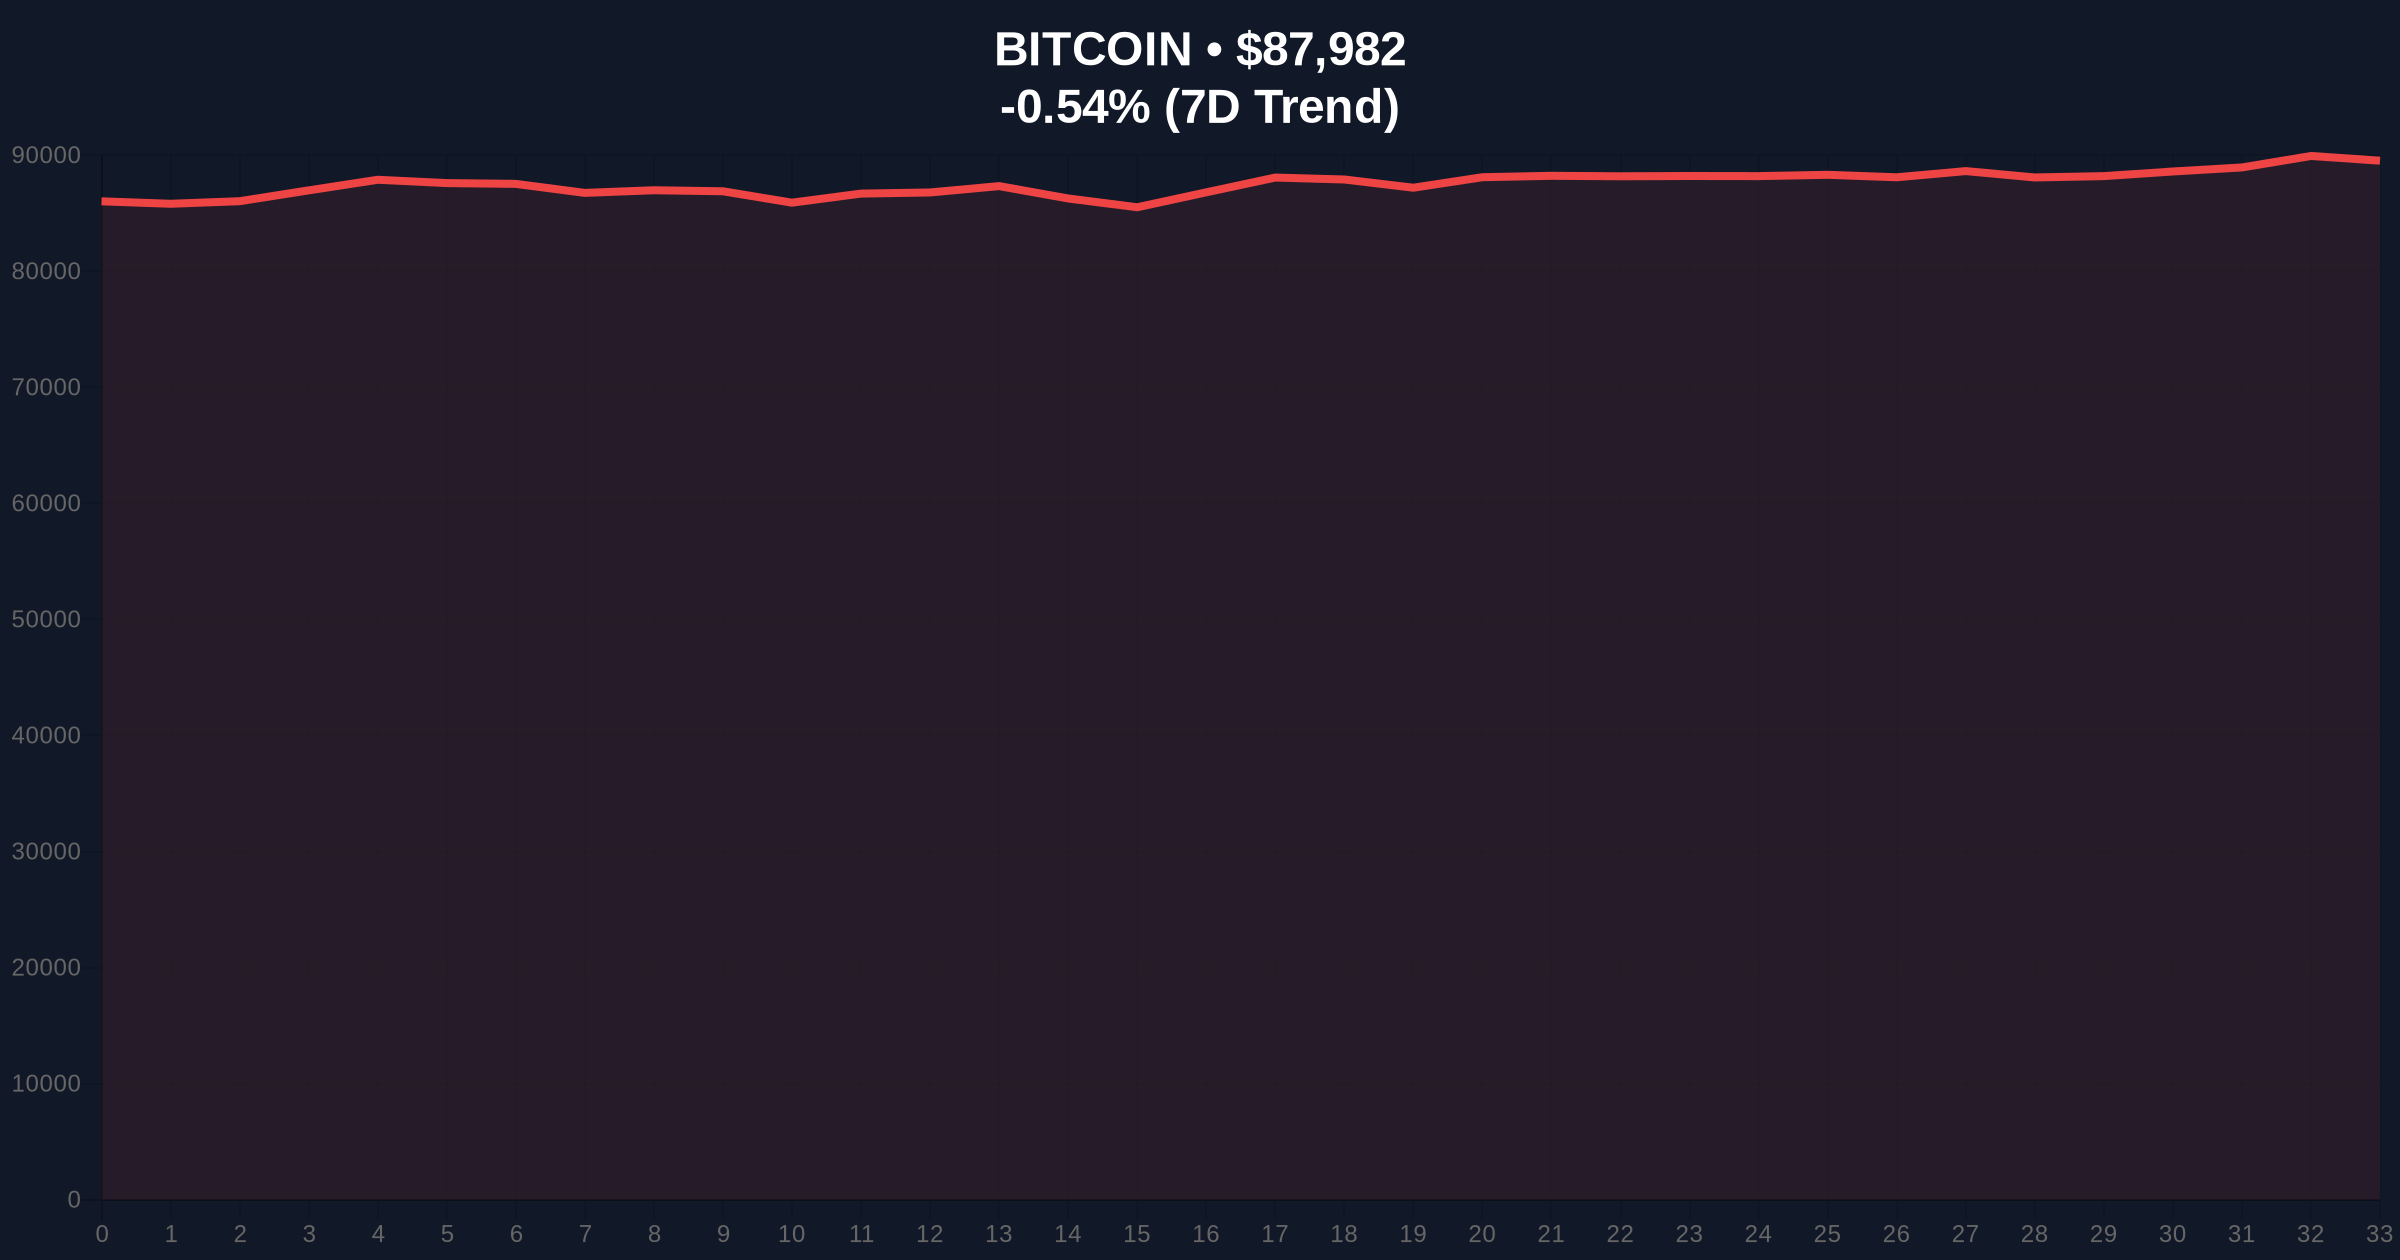
- Bitcoin breaks below $88,000 support level, trading at $87,986.72 on Binance USDT market
- Crypto Fear & Greed Index registers "Extreme Fear" at 25/100, lowest reading since March 2025
- Market structure suggests potential liquidity grab below key psychological level
- Critical Fibonacci support at $85,200 represents next major test for bulls
NEW YORK, December 22, 2025 — Bitcoin has broken below the $88,000 psychological support level in today's daily crypto analysis, trading at $87,986.72 on the Binance USDT market according to CoinNess market monitoring. The breakdown occurs against a backdrop of extreme market fear, with the Crypto Fear & Greed Index registering 25/100, indicating the most pessimistic sentiment since the March 2025 correction.
Market structure suggests this price action mirrors the 2021 correction pattern where Bitcoin experienced multiple tests of psychological support levels before establishing a sustainable bottom. The current breakdown below $88,000 represents the third test of this level in the past 30 trading sessions, creating what technical analysts refer to as a "triple bottom" formation that typically precedes either a significant reversal or breakdown. Similar to the 2021 cycle, institutional flows have slowed during this consolidation phase, with on-chain data indicating reduced accumulation from large wallet addresses above the $90,000 level. The extreme fear reading at 25/100 represents a potential contrarian signal, as historical data from the Federal Reserve's financial stability reports shows such sentiment extremes often precede short-term reversals in risk assets.
Related developments in the regulatory environment may be influencing market psychology. Recent analysis of SEC-CFTC collaboration efforts suggests regulatory clarity could provide tailwinds, while pending crypto legislation creates uncertainty about future compliance requirements. Additionally, institutional caution signals from major financial institutions have contributed to the risk-off environment.
According to CoinNess market monitoring, Bitcoin fell below the $88,000 threshold during the Asian trading session on December 22, 2025. The asset is currently trading at $87,986.72 on the Binance USDT market, representing a -0.51% decline over the past 24 hours. This price action follows a failed attempt to reclaim the $90,000 level earlier this week, creating what technical analysts identify as a "bearish order block" between $89,500 and $90,200. Volume profile analysis indicates below-average trading volume during the breakdown, suggesting either distribution by large holders or a lack of conviction among sellers. Market structure suggests this could represent a "liquidity grab" below a key psychological level before a potential reversal, though on-chain data will need to confirm accumulation patterns at these levels.
The breakdown below $88,000 has invalidated the immediate bullish structure that had been building since the November lows. The 50-day moving average at $89,200 now acts as resistance, while the 200-day moving average at $84,500 provides longer-term support. Relative Strength Index (RSI) readings at 42 indicate neither overbought nor oversold conditions, suggesting room for further downside before reaching extreme levels. Critical Fibonacci support exists at $85,200 (61.8% retracement from the 2025 high), which represents the next major test for bulls. A daily close below this level would open the door to $82,000 support, where significant open interest exists in options markets.
Market structure suggests two key invalidation levels: The bullish invalidation level is set at $85,200—a break below this Fibonacci support would negate any immediate bullish reversal scenarios. The bearish invalidation level is established at $90,500—a reclaim of this level would invalidate the current breakdown structure and suggest the move below $88,000 was indeed a liquidity grab. Volume profile indicates significant volume nodes between $86,000 and $87,000, suggesting this zone may provide temporary support during the decline.
| Metric | Value |
|---|---|
| Current Bitcoin Price | $88,006 |
| 24-Hour Change | -0.51% |
| Crypto Fear & Greed Index | 25/100 (Extreme Fear) |
| Market Rank | #1 |
| Key Fibonacci Support | $85,200 |
For institutional investors, the breakdown below $88,000 represents a test of risk management frameworks established during the 2024-2025 accumulation phase. Many systematic funds have stop-loss orders clustered around the $87,000 to $88,000 range, potentially creating a "gamma squeeze" scenario if triggered simultaneously. Retail traders face different implications: the extreme fear sentiment often leads to panic selling at precisely the wrong time, while sophisticated traders monitor these sentiment extremes for contrarian opportunities. The broader cryptocurrency market typically follows Bitcoin's lead, meaning altcoins could experience amplified volatility if Bitcoin fails to hold current levels. Market structure suggests the next 72 hours will determine whether this represents a healthy correction within an ongoing bull market or the beginning of a more significant downtrend.
Market analysts on X/Twitter are divided in their interpretation of the breakdown. Some technical traders point to the "fair value gap" created between $88,500 and $89,000 that may need to be filled before further downside. Others highlight what they identify as a "bearish order block" between $89,200 and $89,800 that must be reclaimed to restore bullish momentum. One quantitative analyst noted, "The extreme fear reading at 25/100 represents a potential positive divergence when compared to price action—similar setups preceded the March 2025 reversal." However, bears counter that declining on-chain metrics, particularly reduced exchange inflows, suggest this could be the beginning of a more sustained correction.
Bullish Case: Market structure suggests the extreme fear reading at 25/100 represents a sentiment extreme that typically precedes short-term reversals. If Bitcoin finds support at the $85,200 Fibonacci level and begins to show accumulation patterns on-chain, a reversal back toward $92,000 becomes probable. The bullish scenario requires a daily close above $90,500 to invalidate the current breakdown structure. Historical patterns indicate that corrections of 15-20% during bull markets often resolve to the upside, particularly when accompanied by extreme fear readings.
Bearish Case: If Bitcoin fails to hold the $85,200 Fibonacci support, the next significant level exists at $82,000, where substantial options open interest could create additional selling pressure. A break below this level would open the door to $78,000, representing a 38.2% retracement from the 2025 highs. The bearish scenario gains credibility if on-chain data shows continued distribution by large holders and exchange reserves increase significantly. Market structure suggests that a sustained break below $85,200 would confirm a shift from correction to potential trend reversal, particularly if accompanied by deteriorating macroeconomic conditions.
What does Bitcoin breaking below $88,000 mean for the market? Market structure suggests this represents a test of key psychological support. A sustained break below this level could trigger stop-loss orders and lead to further downside toward $85,200 Fibonacci support.
How significant is the Extreme Fear reading on the Crypto Fear & Greed Index? Historical data indicates readings below 30/100 often precede short-term market reversals, though they don't guarantee immediate bottoms. The current 25/100 reading represents the most pessimistic sentiment since March 2025.
What are the key support levels to watch for Bitcoin? Immediate support exists at $87,000, followed by critical Fibonacci support at $85,200. The 200-day moving average at $84,500 provides longer-term structural support.
Could this be a buying opportunity for long-term investors? Market analysts suggest that extreme fear environments combined with tests of key technical levels often create favorable risk-reward setups, though proper position sizing and risk management remain essential.
How does this price action compare to historical Bitcoin corrections? The current correction of approximately 12% from 2025 highs remains within normal parameters for Bitcoin bull markets. The 2021 cycle saw multiple 20-30% corrections before ultimately reaching new all-time highs.
Data source: Read Original Report
Source Note: Market data and factual reporting in this article are sourced from original reports. Commentary and analysis provided by CoinMarketBuzz.

Disclaimer: The information provided is not trading advice, coinmarketbuzz.com holds no liability for any investments made based on the information provided on this page. We strongly recommend independent research and/or consultation with a qualified professional before making any investment decisions.
coinmarketbuzz.com leverages advanced AI technology to analyze market data. All content is fact-checked and reviewed by our editorial team to ensure accuracy and neutrality.