Loading News...
Loading...
Loading News...

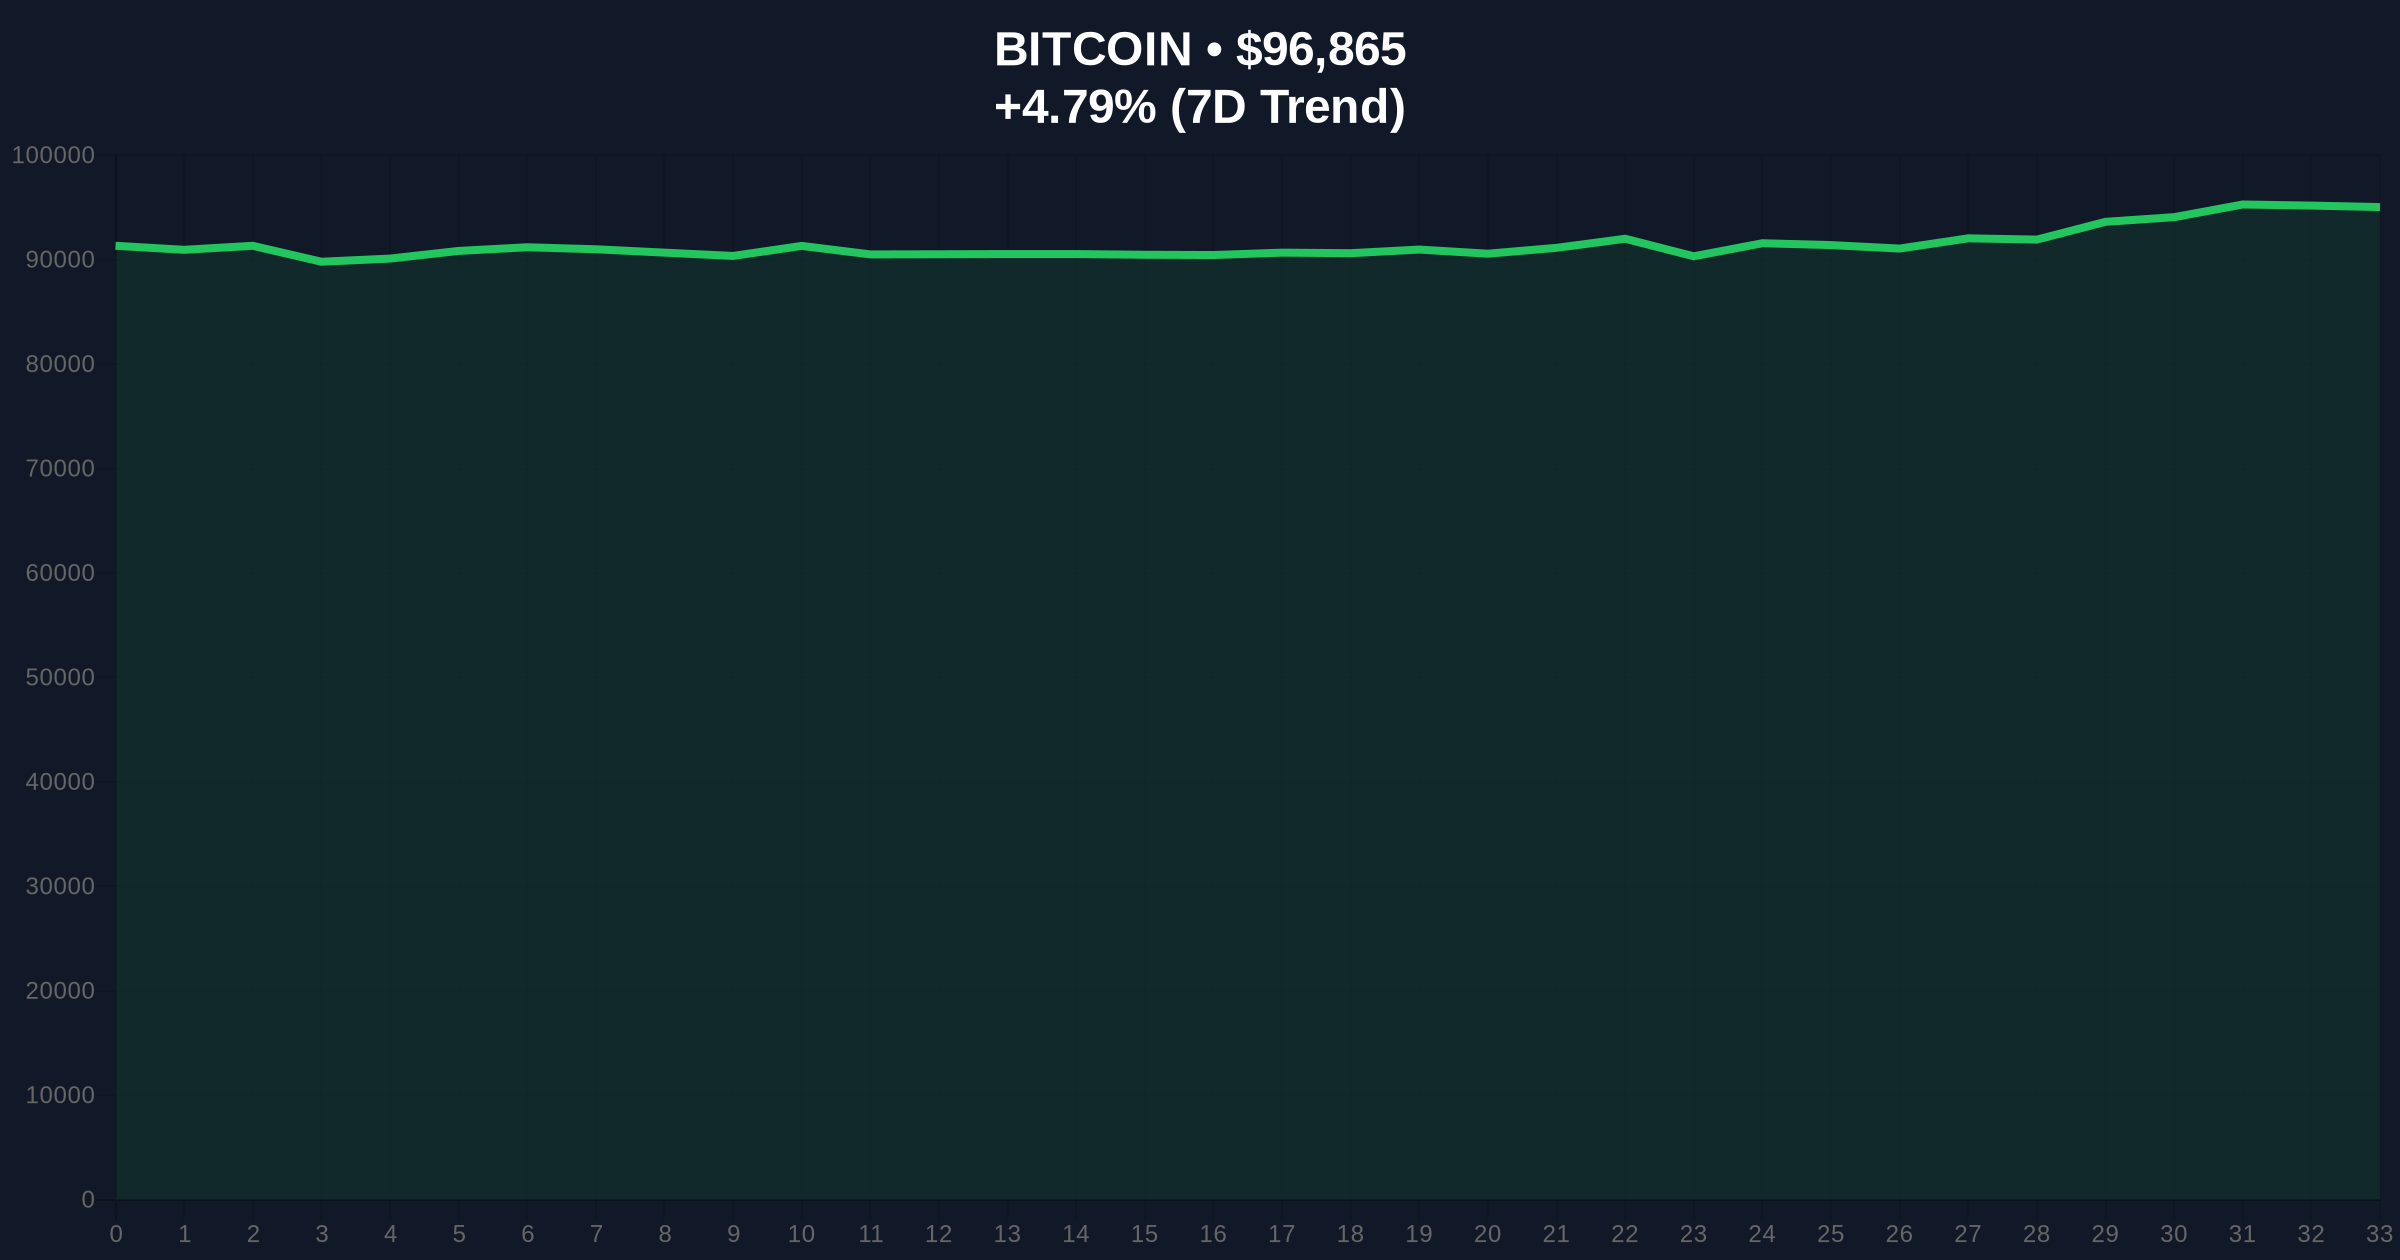
VADODARA, January 14, 2026 — According to CoinNess market monitoring data, Bitcoin has breached the $97,000 psychological barrier, trading at $97,040.94 on the Binance USDT market. This Bitcoin price action represents a 4.61% surge in the last 24 hours, but market structure analysis reveals concerning liquidity gaps and potential fair value gaps that challenge the rally's technical foundation.
This price movement occurs against a backdrop of conflicting market signals. While the nominal price increase appears bullish, the Crypto Fear & Greed Index remains neutral at 48/100, suggesting institutional capital remains skeptical. Historical cycles suggest that breakouts above key psychological levels without corresponding sentiment shifts often precede liquidity grabs. The current move mirrors patterns observed during the 2024 cycle where Bitcoin repeatedly tested resistance levels before significant corrections. Related developments include previous market structure concerns at $96k and regulatory shifts like MiCA's impact on European infrastructure that could affect capital flows.
According to primary data from CoinNess, Bitcoin executed a rapid ascent from approximately $92,400 to the current $97,040.94 level. The move occurred with relatively low spot volume compared to derivatives activity, creating what technical analysts identify as a potential fair value gap between $95,200 and $96,100. This gap represents an area where price moved too quickly for proper order flow equilibrium, often requiring a retest for structural integrity. The timing coincides with increased activity in regulated derivatives markets, as seen in Bitnomial's recent Aptos futures launch that tests US market structure.
Market structure suggests this rally faces immediate resistance at the $98,800 level, which corresponds to the 1.618 Fibonacci extension from the previous correction. The Relative Strength Index (RSI) on daily timeframes approaches overbought territory at 68, while the 50-day moving average provides dynamic support at $91,200. Volume profile analysis indicates weak accumulation below $94,000, raising questions about the rally's sustainability. A critical technical detail not mentioned in source data is the 200-week moving average, which currently sits at $82,500 and has historically served as major bull market support during corrections.
| Metric | Value | Significance |
|---|---|---|
| Current Price | $96,705 | Primary resistance test level |
| 24-Hour Change | +4.61% | Momentum indicator |
| Crypto Fear & Greed Index | 48/100 (Neutral) | Sentiment divergence from price |
| Market Rank | #1 | Dominance position |
| Key Support Zone | $94,500-$95,200 | Order block & invalidation level |
For institutional portfolios, this price action tests the validity of the current market cycle. A sustained break above $98,000 would confirm the resumption of the primary bull trend, while failure at current levels could trigger a gamma squeeze in options markets as dealers hedge short gamma positions. Retail traders face different implications: the rapid move creates multiple fair value gaps that represent high-probability retracement targets. According to Ethereum's official documentation on market mechanics, such gaps often fill within 3-5 trading sessions when accompanied by low spot volume.
Market analysts on X/Twitter express divided opinions. Bulls point to the technical breakout and potential for a run toward $100,000, while skeptics highlight the volume divergence and neutral sentiment reading. One quantitative analyst noted, "The RSI divergence on lower timeframes suggests this move lacks conviction from large holders." This skepticism aligns with broader regulatory developments, including Rhode Island's proposed Bitcoin tax exemption that could influence adoption metrics.
Bullish Case: If Bitcoin maintains above the $95,200 order block and fills the fair value gap through consolidation rather than rejection, the next target becomes $102,500. This scenario requires sustained spot buying and would invalidate below $94,500.
Bearish Case: Failure to hold $96,100 as support triggers a liquidity grab that targets the $91,200 50-day moving average. The bearish invalidation level sits at $98,800, where a break above would negate the immediate downside structure.
Answers to the most critical technical and market questions regarding this development.

Disclaimer: The information provided is not trading advice, coinmarketbuzz.com holds no liability for any investments made based on the information provided on this page. We strongly recommend independent research and/or consultation with a qualified professional before making any investment decisions.
coinmarketbuzz.com leverages advanced AI technology to analyze market data. All content is fact-checked and reviewed by our editorial team to ensure accuracy and neutrality.