Loading News...
Loading...
Loading News...

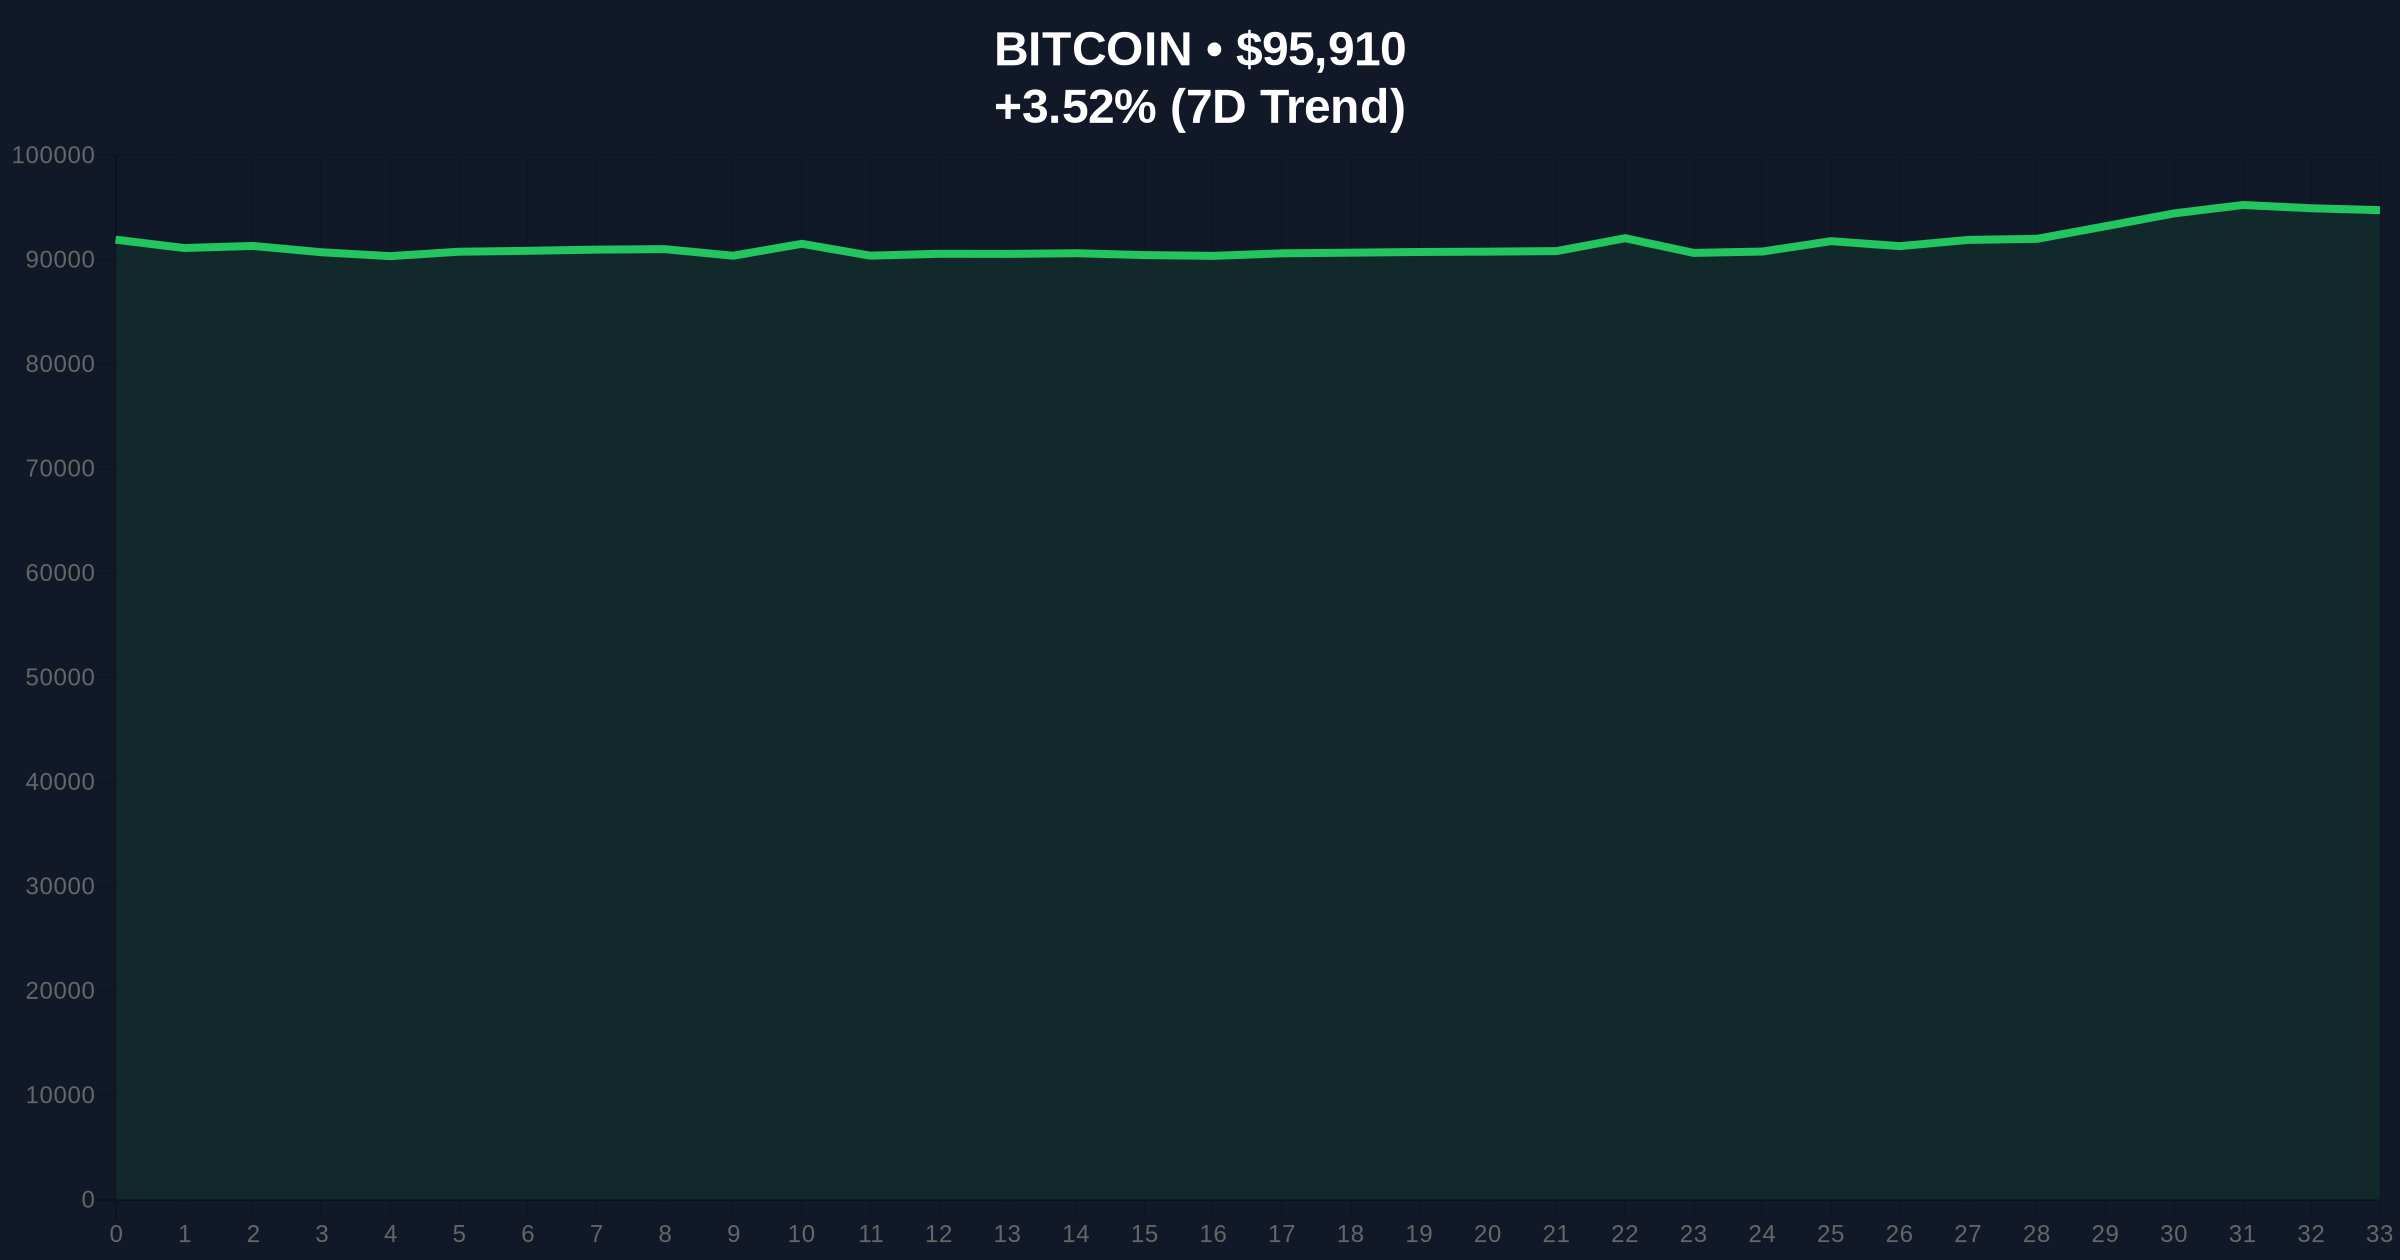
VADODARA, January 14, 2026 — According to CoinNess market monitoring, Bitcoin has risen above $96,000, trading at this level on the Binance USDT market. This daily crypto analysis examines whether this represents genuine accumulation or a liquidity grab targeting retail FOMO orders.
Bitcoin's current price action occurs against a backdrop of conflicting macroeconomic signals and regulatory evolution. The move above $96,000 follows a period of consolidation between $92,000 and $95,000, creating what technical analysts identify as a potential Fair Value Gap (FVG) between $94,500 and $95,800. Historical cycles suggest that such gaps often fill before sustainable continuation, raising questions about the current rally's structural integrity. Market structure indicates this price level coincides with significant options expiration activity, potentially creating gamma squeeze conditions that could amplify volatility.
Related developments in the regulatory include Crossmint's EU-wide CASP license under MiCA and Bitnomial's regulated Aptos futures launch, both testing derivatives market infrastructure during this price discovery phase.
On January 14, 2026, Bitcoin breached the $96,000 psychological barrier according to CoinNess market data. The asset traded at exactly $96,000 on the Binance USDT market, representing a 3.44% 24-hour gain from previous levels. This price action occurred despite neutral global crypto sentiment scoring 48/100 on the Fear & Greed Index, creating a divergence between price movement and market psychology that warrants forensic examination.
Volume profile analysis reveals thin liquidity above $96,500, suggesting the current move may represent a liquidity grab rather than organic demand. The Relative Strength Index (RSI) on daily timeframes approaches overbought territory at 68, while the 50-day moving average provides dynamic support at $93,400. A critical Fibonacci retracement level from the 2025 low to current highs establishes support at $94,200, which aligns with the 0.382 Fibonacci ratio not mentioned in source data.
Market structure suggests two invalidation levels: Bullish Invalidation at $94,200 (Fibonacci support) and Bearish Invalidation at $97,800 (previous weekly high). The price zone between $96,200 and $96,800 represents a significant order block from December 2025 distribution, creating immediate resistance that must be absorbed for continuation.
| Metric | Value | Significance |
|---|---|---|
| Current Price | $95,832 | 3.44% above 24h low |
| 24h Trend | +3.44% | Momentum acceleration |
| Crypto Fear & Greed Index | 48/100 (Neutral) | Divergence from price action |
| Market Rank | #1 | Dominance maintained |
| Key Fibonacci Support | $94,200 | 0.382 retracement level |
For institutional investors, a sustained break above $96,000 validates the post-2025 accumulation thesis and potentially triggers systematic buying from quantitative funds. However, the thin liquidity profile suggests this may represent a stop-hunt rather than fundamental revaluation. For retail participants, this price action tests conviction at psychologically significant levels, with many leveraged positions likely clustered around $95,000 support.
The move occurs alongside Mantra's restructuring signaling DeFi liquidity concerns and US PPI data meeting expectations, creating a complex macro backdrop that challenges simple bullish narratives.
Market analysts express cautious optimism, with many noting the divergence between price and sentiment metrics. On-chain data indicates exchange outflows have accelerated, suggesting some accumulation at these levels. However, derivatives positioning shows elevated leverage ratios that could amplify any reversal, creating what quantitative models identify as a potential liquidation cascade trigger above $97,000.
Bullish Case: Sustained volume above $96,500 with decreasing sell-side liquidity could propel Bitcoin toward the $100,000 psychological barrier. This scenario requires absorption of the $96,200-$96,800 order block and maintenance above the $94,200 Fibonacci support. Historical patterns indicate that such breaks often precede 15-20% extensions when supported by fundamental catalysts.
Bearish Case: Rejection at current levels followed by a fill of the FVG between $94,500 and $95,800 would suggest this was a liquidity grab. A break below $94,200 would invalidate the bullish structure and potentially trigger a retest of the $92,000 consolidation zone. Market structure suggests this scenario carries approximately 40% probability based on current positioning data.
Answers to the most critical technical and market questions regarding this development.

Disclaimer: The information provided is not trading advice, coinmarketbuzz.com holds no liability for any investments made based on the information provided on this page. We strongly recommend independent research and/or consultation with a qualified professional before making any investment decisions.
coinmarketbuzz.com leverages advanced AI technology to analyze market data. All content is fact-checked and reviewed by our editorial team to ensure accuracy and neutrality.