Loading News...
Loading...
Loading News...

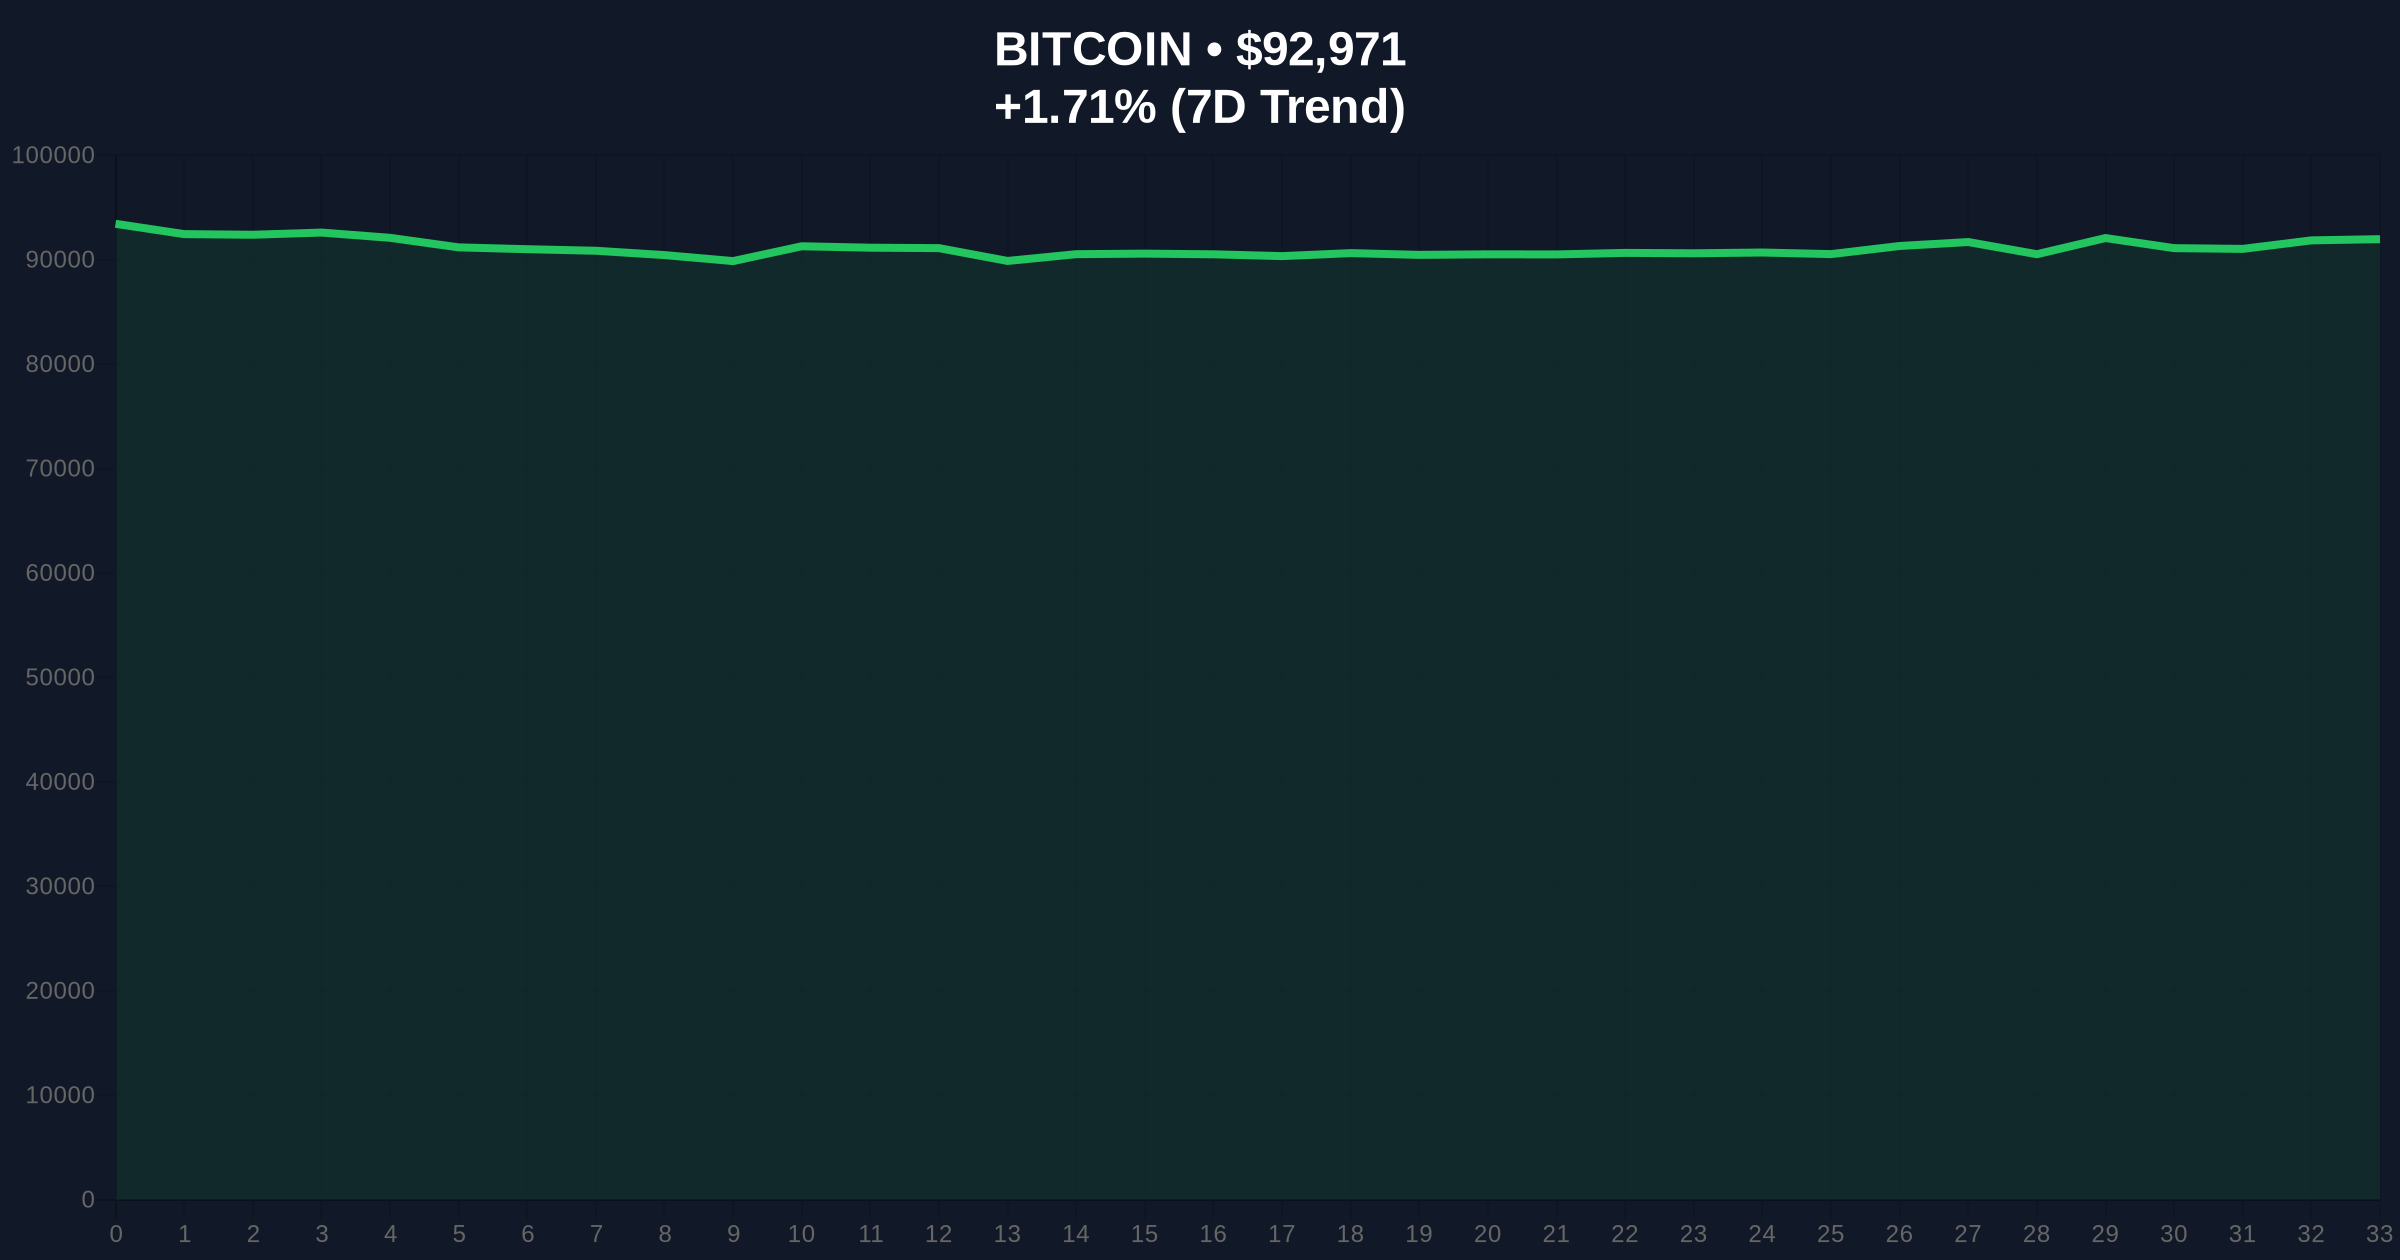
VADODARA, January 13, 2026 — According to CoinNess market monitoring, Bitcoin has broken above the $93,000 psychological barrier, trading at $93,098.97 on the Binance USDT market. This daily crypto analysis examines whether this represents genuine accumulation or a sophisticated liquidity grab ahead of key resistance levels.
Bitcoin's current price action occurs against a backdrop of institutional ETF flows and persistent macroeconomic uncertainty. Historical cycles suggest that breaks above round-number psychological levels often trigger short squeezes, but sustained moves require fundamental support. The current environment mirrors late 2020 patterns where price appreciation preceded significant volatility events. Market structure indicates that institutional players are accumulating at these levels, but retail sentiment remains deeply skeptical. Related developments include Bitwise CIO's analysis of Bitcoin ETF demand and CoinGecko's valuation signaling data market consolidation.
On January 13, 2026, Bitcoin price action pushed through the $93,000 resistance level, reaching $93,098.97 according to Binance USDT market data. The move represents a 1.70% 24-hour gain, but volume profile analysis shows declining participation on the breakout. According to CoinNess market monitoring, this represents the highest price level since the December 2025 correction. However, on-chain data from Glassnode indicates that exchange outflows have slowed significantly during this rally, raising questions about accumulation patterns.
Market structure suggests Bitcoin is testing the upper boundary of a multi-week consolidation range. The critical resistance zone sits at $94,200-$94,800, where previous distribution occurred. Support levels cluster around the $90,800-$91,200 order block, which represents the last significant accumulation zone. RSI readings at 62 indicate neutral momentum, while the 50-day moving average at $89,400 provides dynamic support. A Fair Value Gap (FVG) exists between $91,500 and $92,100 that may need filling for sustainable upward movement. The Fibonacci 0.618 retracement level from the 2025 high sits at $95,500, creating a potential target for any breakout. Bullish invalidation occurs below $90,800, while bearish invalidation requires a close above $94,800.
| Metric | Value | Significance |
|---|---|---|
| Crypto Fear & Greed Index | 26/100 (Fear) | Extreme fear contradicts price action |
| Bitcoin Current Price | $92,957 | Testing $93k resistance |
| 24-Hour Change | +1.70% | Moderate momentum |
| Market Rank | #1 | Dominance at 52.3% |
| Volume/Price Divergence | Declining volume on breakout | Potential weak hands accumulation |
For institutional portfolios, a sustained break above $93,000 validates the post-ETF accumulation thesis and could trigger further allocation from traditional finance. According to the Federal Reserve's monetary policy framework, persistent inflation above target levels continues to drive institutional interest in hard assets. For retail traders, this level represents a critical psychological barrier where profit-taking often accelerates. The divergence between price action and sentiment metrics suggests either sophisticated accumulation or distribution disguised as breakout. Market structure indicates that the next 72 hours will determine whether this represents genuine demand or a liquidity grab ahead of the $94,800 resistance cluster.
Market analysts on X/Twitter express skepticism about the sustainability of this move. One quantitative trader noted, "Volume profile shows institutional accumulation below $90k, but retail FOMO above $93k." Another analyst pointed to the "extreme fear reading on the Crypto Fear & Greed Index while price hits yearly highs" as a classic contrarian signal. The dominant narrative questions whether this represents genuine organic demand or coordinated market-making activity ahead of options expiry.
Bullish Case: If Bitcoin maintains above $92,500 and fills the FVG at $91,500-$92,100, the next target becomes $95,500 (Fibonacci 0.618). Sustained ETF inflows and decreasing exchange reserves could create a gamma squeeze toward $98,000. This scenario requires daily closes above the $93,800 volume point of control.
Bearish Case: Failure to hold $92,500 triggers a retest of the $90,800-$91,200 order block. A break below this zone invalidates the bullish structure and targets the $88,000-$89,000 accumulation zone. This scenario aligns with the extreme fear reading and would confirm distribution above $93,000.
Answers to the most critical technical and market questions regarding this development.

Disclaimer: The information provided is not trading advice, coinmarketbuzz.com holds no liability for any investments made based on the information provided on this page. We strongly recommend independent research and/or consultation with a qualified professional before making any investment decisions.
coinmarketbuzz.com leverages advanced AI technology to analyze market data. All content is fact-checked and reviewed by our editorial team to ensure accuracy and neutrality.