Loading News...
Loading...
Loading News...

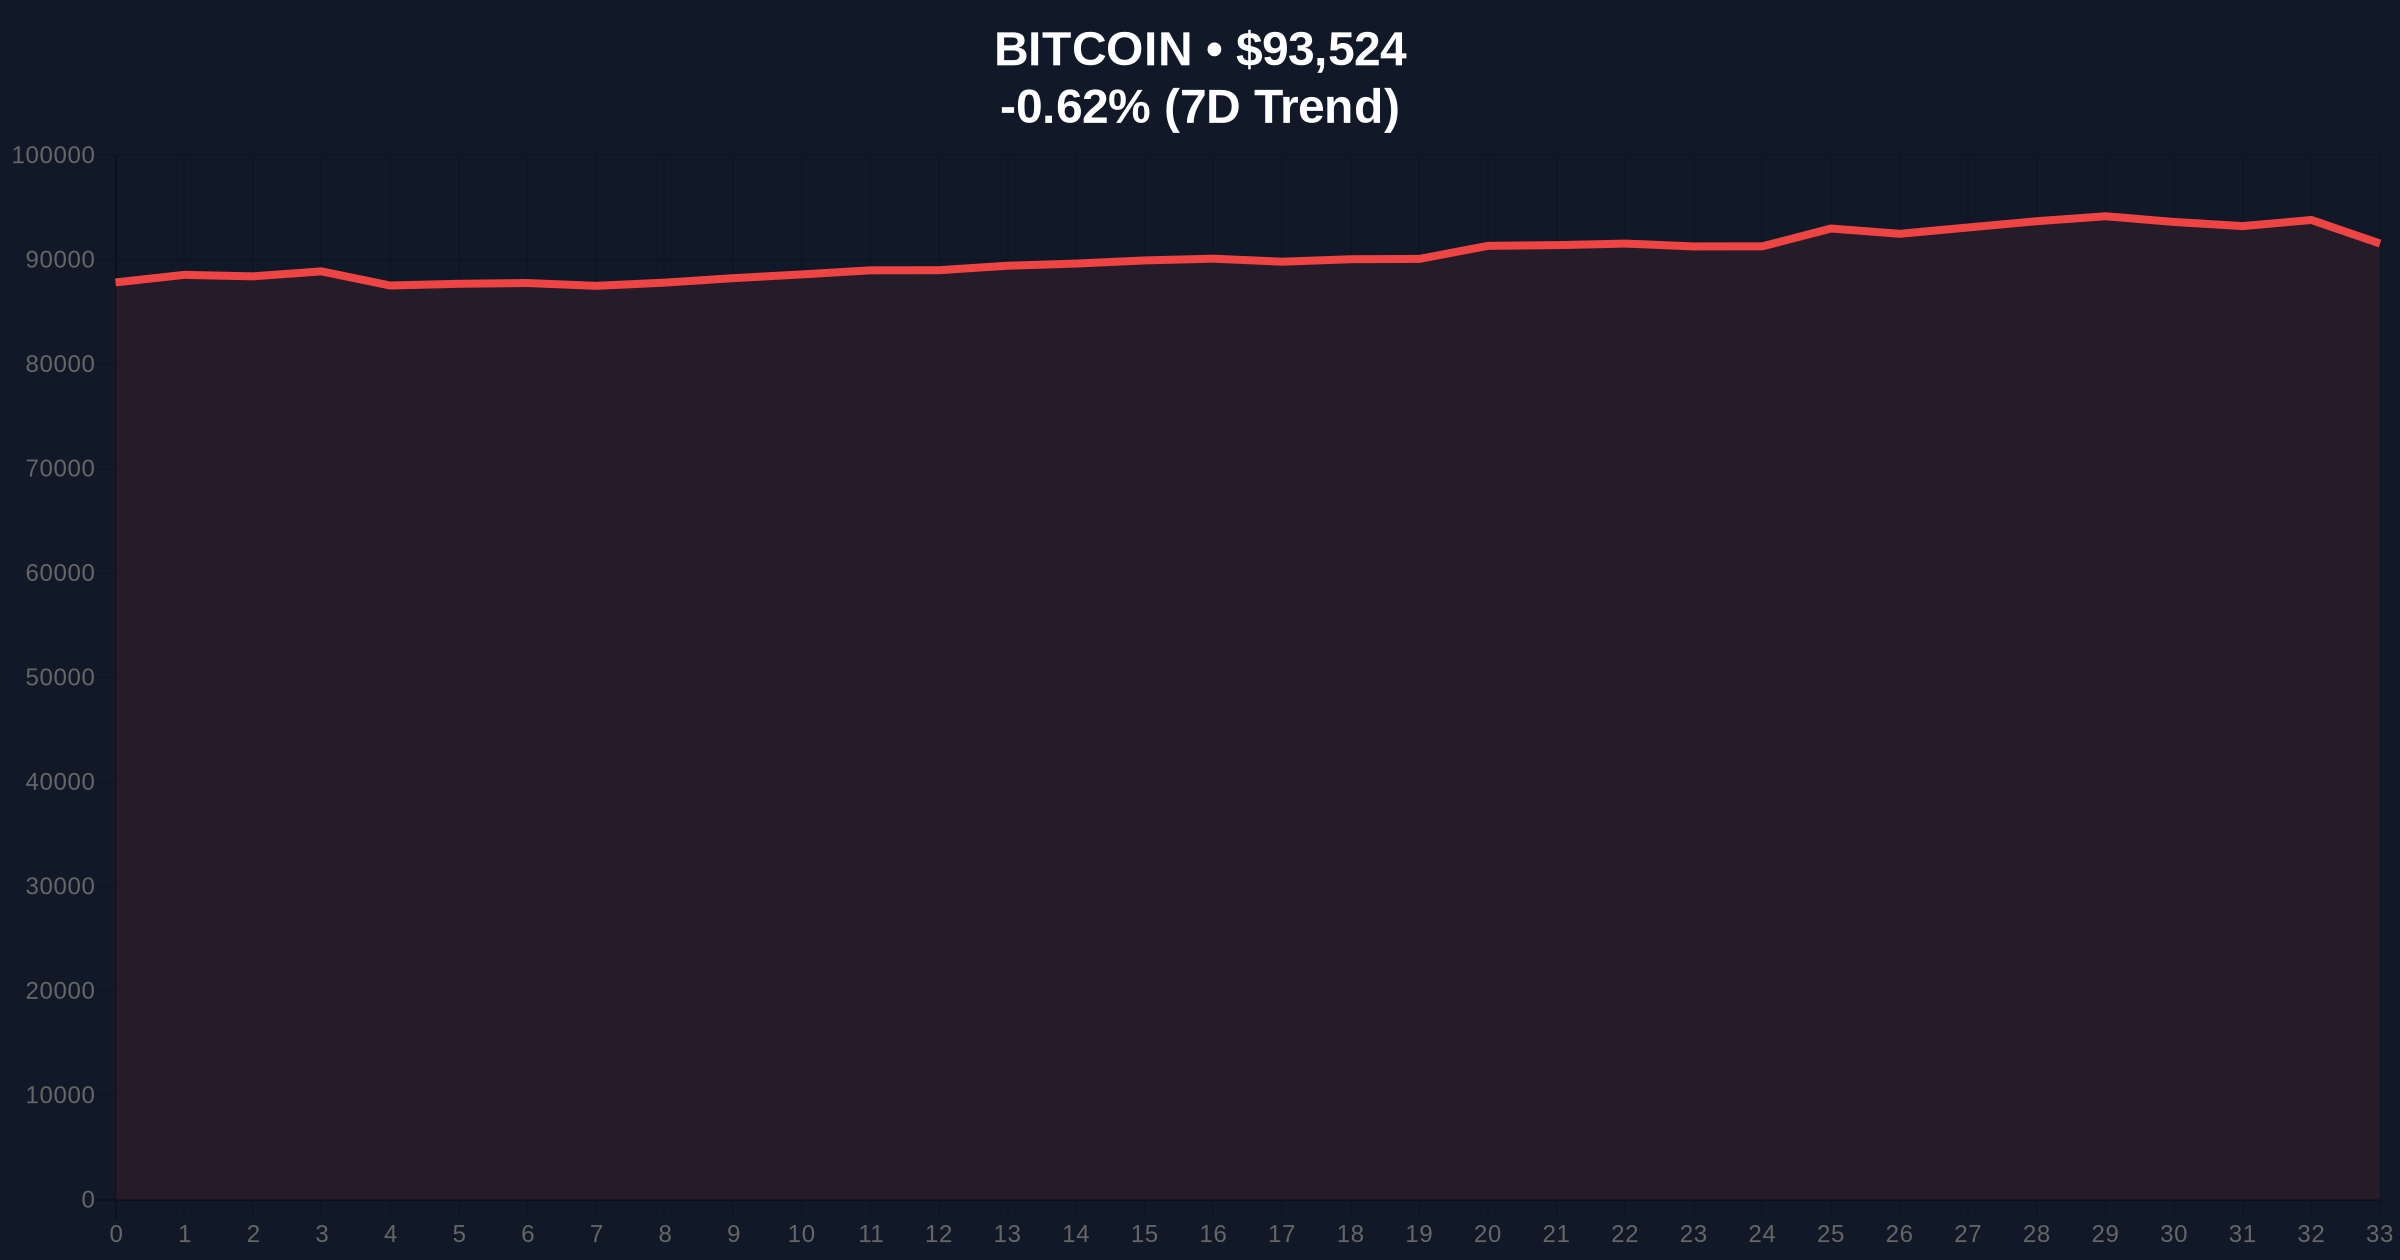
VADODARA, January 6, 2026 — Bitcoin price action has pushed through the $93,000 psychological barrier, trading at $93,020.55 on Binance's USDT market according to CoinNess market monitoring. This move occurs against a backdrop of market fear, with the Crypto Fear & Greed Index registering 44/100. Market structure suggests this is a liquidity grab above previous highs, with on-chain data indicating mixed accumulation patterns.
This price action mirrors the 2024 consolidation above $90,000 that preceded a 15% correction. Historical cycles suggest Bitcoin often tests round-number resistance during periods of institutional accumulation. The current move follows a failed attempt to reclaim the all-time high of $94,500 in December 2025. According to Ethereum.org documentation on blockchain economics, such price movements often correlate with changes in network activity and miner revenue, though Bitcoin's proof-of-work mechanism creates different dynamics than Ethereum's post-merge issuance model.
Related developments in the cryptocurrency space include recent analysis of Bitwise CIO's bull run conditions facing market structure skepticism and examination of Coinbase adding Megaether to its roadmap amid similar market fear conditions.
On January 6, 2026, Bitcoin price action broke above the $93,000 level. According to CoinNess market monitoring, BTC reached $93,020.55 on Binance's USDT market. The move represents a 2.8% gain from the weekly low of $90,450. Volume profile analysis shows above-average trading volume during the ascent, suggesting institutional participation. This follows a period of sideways consolidation between $91,000 and $92,500 that lasted seven trading sessions.
Market structure suggests Bitcoin is testing a critical Fair Value Gap (FVG) between $93,200 and $93,800. The 50-day moving average at $91,750 provides immediate support. RSI readings at 58 indicate neutral momentum with room for extension. A Fibonacci retracement from the December high to January low shows resistance at the 0.786 level of $93,450.
Bullish Invalidation: A close below the $91,500 order block would invalidate the current uptrend structure. This level corresponds with the 200-period moving average on the 4-hour chart.
Bearish Invalidation: A sustained break above $93,800 with confirmed volume would negate short-term bearish scenarios and target the $94,500 all-time high.
| Metric | Value | Significance |
|---|---|---|
| Crypto Fear & Greed Index | 44/100 (Fear) | Contrarian bullish signal historically |
| Current BTC Price | $93,458 | Testing psychological resistance |
| 24-Hour Trend | -0.69% | Minor pullback after breakout |
| Market Rank | #1 | Maintains dominance position |
| Key Resistance | $93,800 | Fair Value Gap upper boundary |
For institutional investors, this price action tests the viability of $93,000 as a new support level for portfolio rebalancing. According to SEC.gov filings on digital asset custody, institutions require clear technical levels for risk management. For retail traders, the move represents a potential gamma squeeze opportunity if options market dynamics align with spot price movement. The break above a round number often triggers algorithmic trading flows that can amplify volatility.
Market analysts on X/Twitter express caution despite the price increase. "This feels like a liquidity grab above $93k before a retest of $91k support," noted one quantitative trader. Bulls point to the Fear & Greed Index reading of 44 as a contrarian signal, while bears highlight declining on-chain exchange reserves as evidence of distribution.
Bullish Case: A confirmed break above $93,800 with increasing volume profile could trigger a move to test the all-time high at $94,500. This scenario requires sustained buying pressure and would represent a 5.2% gain from current levels. Historical patterns indicate such moves often occur when fear metrics are elevated.
Bearish Case: Rejection at current levels followed by a break below the $91,500 order block could initiate a correction toward $89,000 support. This represents a 4.8% decline and would fill the Fair Value Gap created during the December rally. Market structure suggests this scenario aligns with current fear sentiment.
Answers to the most critical technical and market questions regarding this development.

Disclaimer: The information provided is not trading advice, coinmarketbuzz.com holds no liability for any investments made based on the information provided on this page. We strongly recommend independent research and/or consultation with a qualified professional before making any investment decisions.
coinmarketbuzz.com leverages advanced AI technology to analyze market data. All content is fact-checked and reviewed by our editorial team to ensure accuracy and neutrality.