Loading News...
Loading...
Loading News...
VADODARA, February 6, 2026 — Blockchain monitoring service Whale Alert detected a 250,000,000 USDC transfer from an unknown wallet to Binance, valued at approximately $250 million. This daily crypto analysis examines the transaction's timing against a backdrop of Extreme Fear sentiment and BNB's sharp decline. Market structure suggests this move may represent a strategic liquidity grab rather than simple deposit activity.
According to Whale Alert data, the transaction occurred on February 6, 2026. The sender address remains unidentified, typical of institutional or large-scale private wallets. The recipient is Binance, one of the world's largest cryptocurrency exchanges by volume. The transfer involved USDC, a fully collateralized stablecoin issued by Circle. This transaction size represents approximately 0.1% of USDC's total circulating supply, per Circle's official transparency reports.
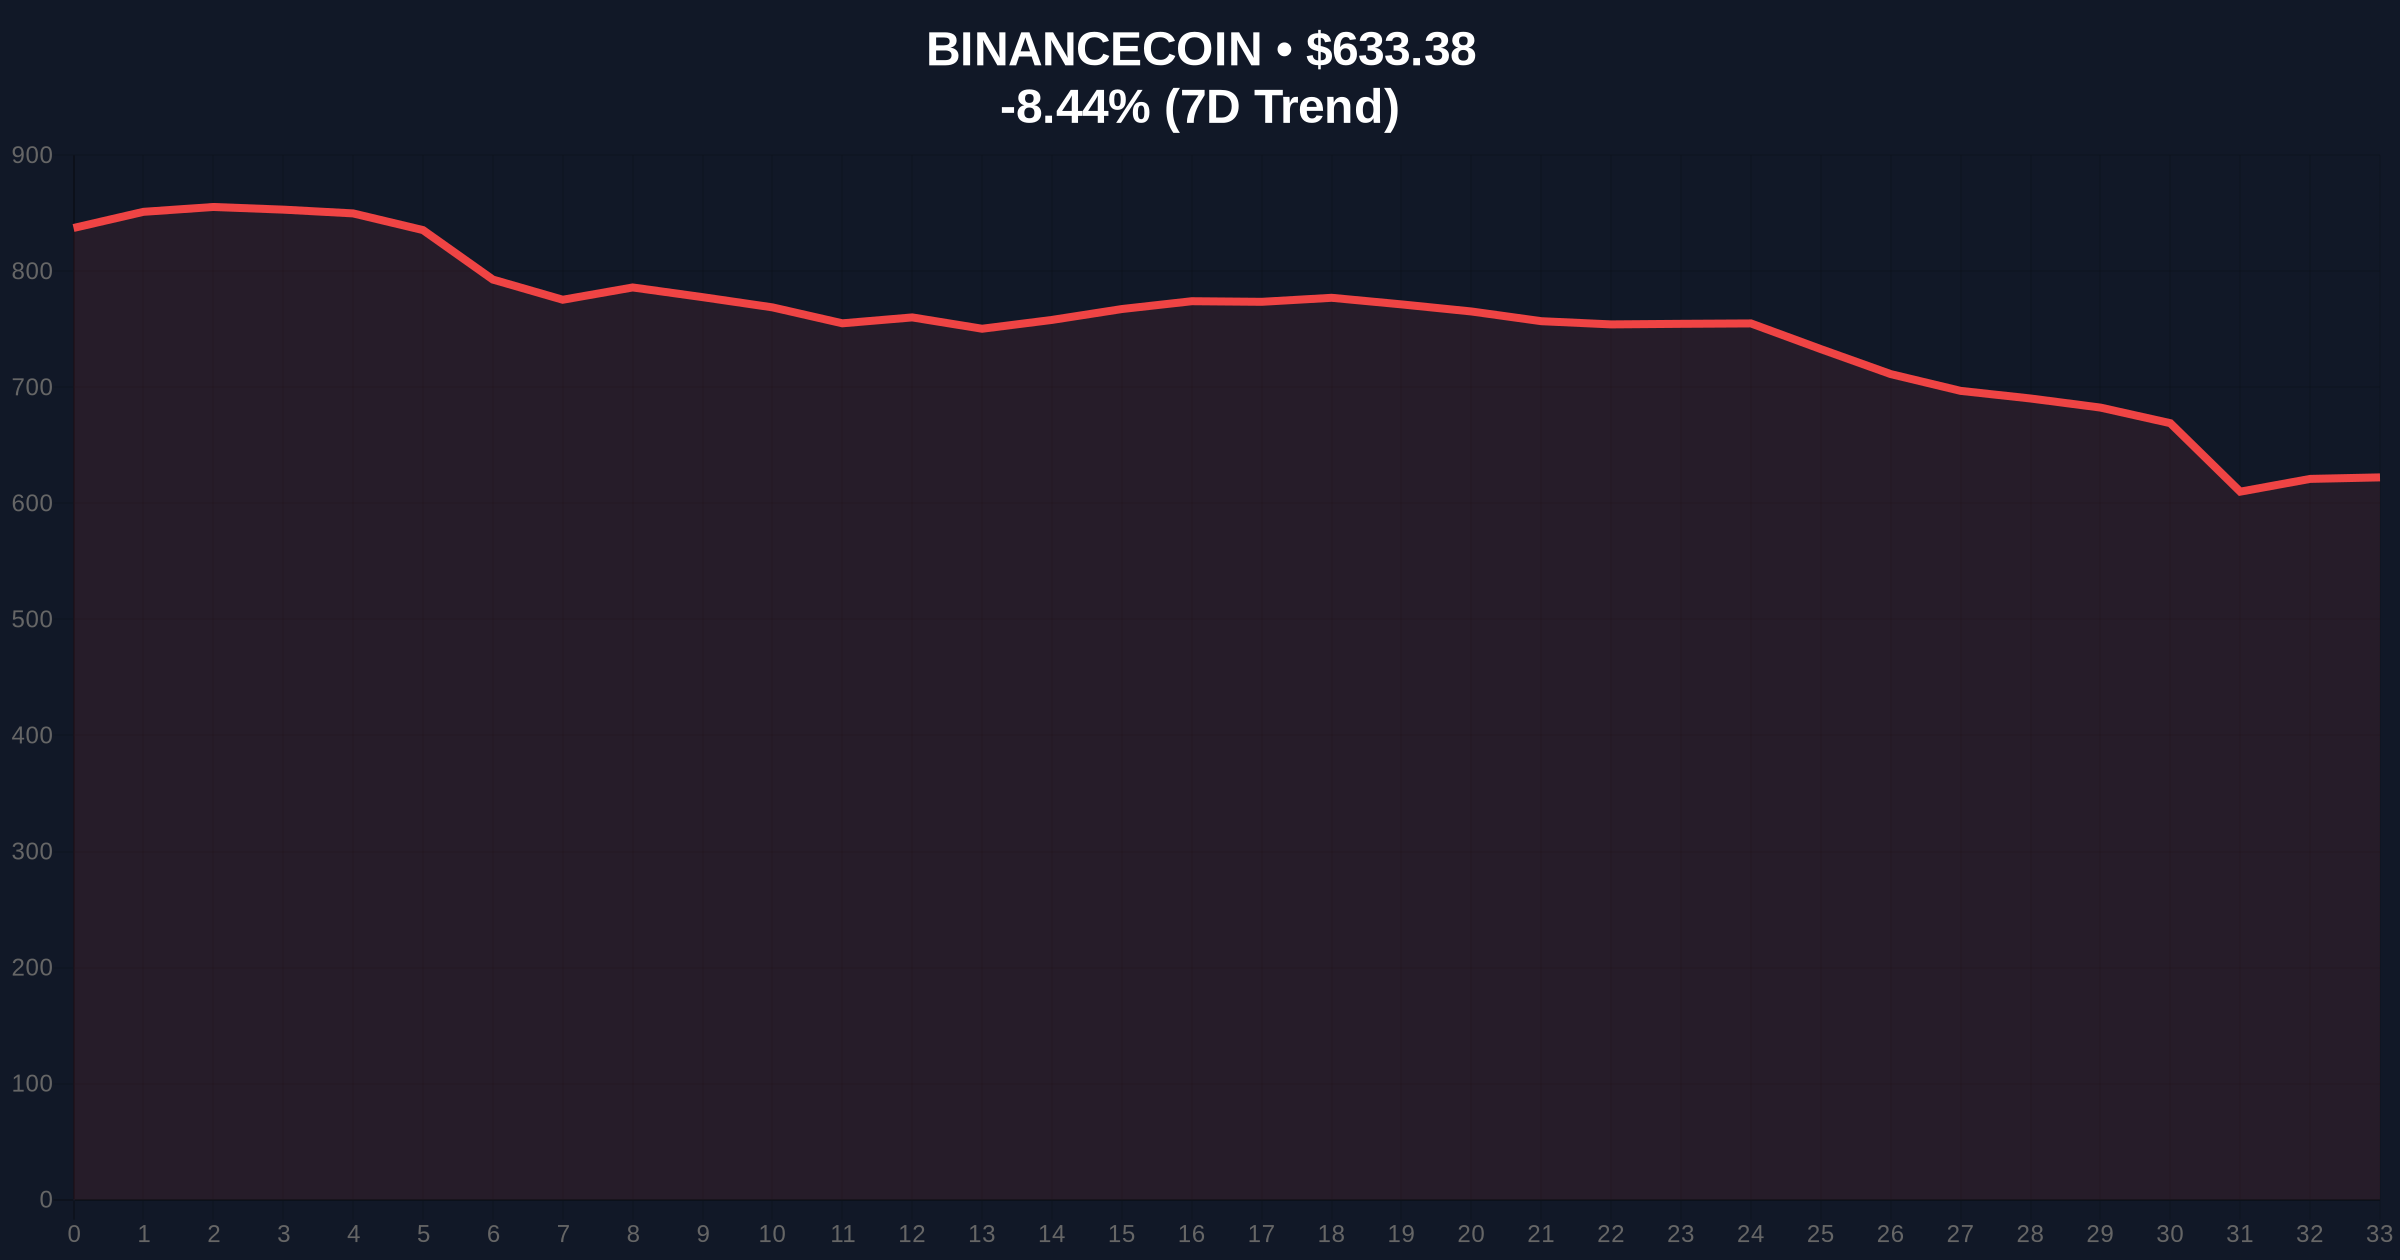
Transaction forensic analysis reveals the move executed in a single block. This efficiency minimizes slippage and visibility. The timing coincides with BNB's -8.46% 24-hour decline to $633.23. Consequently, market participants question whether this capital intends to support BNB liquidity or fund short positions. The lack of sender identification complicates intent analysis.
Historically, large stablecoin inflows to exchanges precede volatility events. They often signal institutional preparation for major trades. In contrast, retail-dominated markets typically show smaller, fragmented deposits. The current Extreme Fear sentiment, scoring 9/100, creates a contrarian setup. Fear-driven markets frequently see smart money accumulation at discounted levels.
This event mirrors patterns observed in previous cycles. For instance, the 2021 bull market saw similar USDC transfers before major rallies. However, the 2022 bear market witnessed exchanges using stablecoin inflows to meet redemption pressures. The ambiguity lies in distinguishing between offensive and defensive positioning. , recent whale activity has drawn scrutiny, as seen in the 600 million USDT transfer that sparked market structure concerns.
BNB's price action shows a clear Fair Value Gap (FVG) between $640 and $650. This gap formed during the rapid decline. Market structure suggests price may revisit this zone to fill liquidity. The Relative Strength Index (RSI) on the 4-hour chart sits at 32, indicating oversold conditions but not extreme capitulation.
The 50-day moving average at $645 acts as dynamic resistance. A break above this level would signal short-term recovery. However, the Fibonacci 0.618 retracement level from the recent swing high to low sits at $615. This level represents critical support. A breakdown below $615 would invalidate the current bullish higher-timeframe structure. Volume profile analysis shows increased selling volume at $633, confirming distribution.
| Metric | Value | Implication |
|---|---|---|
| USDC Transfer Amount | 250,000,000 | 0.1% of USDC supply |
| Transaction Value | $250 million | Major liquidity event |
| Crypto Fear & Greed Index | 9/100 (Extreme Fear) | Contrarian signal |
| BNB Current Price | $633.23 | -8.46% 24h change |
| BNB Market Rank | #4 | Top-tier altcoin |
This transaction matters because it tests market efficiency during stress. Extreme Fear sentiment typically correlates with panic selling. Large stablecoin inflows may indicate sophisticated actors positioning against retail sentiment. Institutional liquidity cycles often begin with such transfers. They provide dry powder for strategic acquisitions or market-making activities.
Retail market structure appears fragile. The transfer could exacerbate volatility if used for large sell orders. Alternatively, it might stabilize prices if deployed as buy-side liquidity. The uncertainty itself affects trader psychology. , this event highlights the importance of ERC-20 token standards like USDC in facilitating large-scale capital movements with minimal friction.
Market structure suggests this is a liquidity grab. The combination of Extreme Fear sentiment and a major exchange inflow creates a classic setup for volatility expansion. We monitor on-chain data for follow-up movements to confirm intent. Historical cycles show similar patterns preceding both rallies and crashes.
— CoinMarketBuzz Intelligence Desk
Two data-backed technical scenarios emerge from current market structure.
The 12-month institutional outlook remains cautiously optimistic. Events like this often mark accumulation phases in broader cycles. However, the 5-year horizon depends on macroeconomic factors like Federal Reserve policy and adoption rates. This transfer may represent early positioning for the next macro move.

Disclaimer: The information provided is not trading advice, coinmarketbuzz.com holds no liability for any investments made based on the information provided on this page. We strongly recommend independent research and/or consultation with a qualified professional before making any investment decisions.
coinmarketbuzz.com leverages advanced AI technology to analyze market data. All content is fact-checked and reviewed by our editorial team to ensure accuracy and neutrality.