Loading News...
Loading...
Loading News...

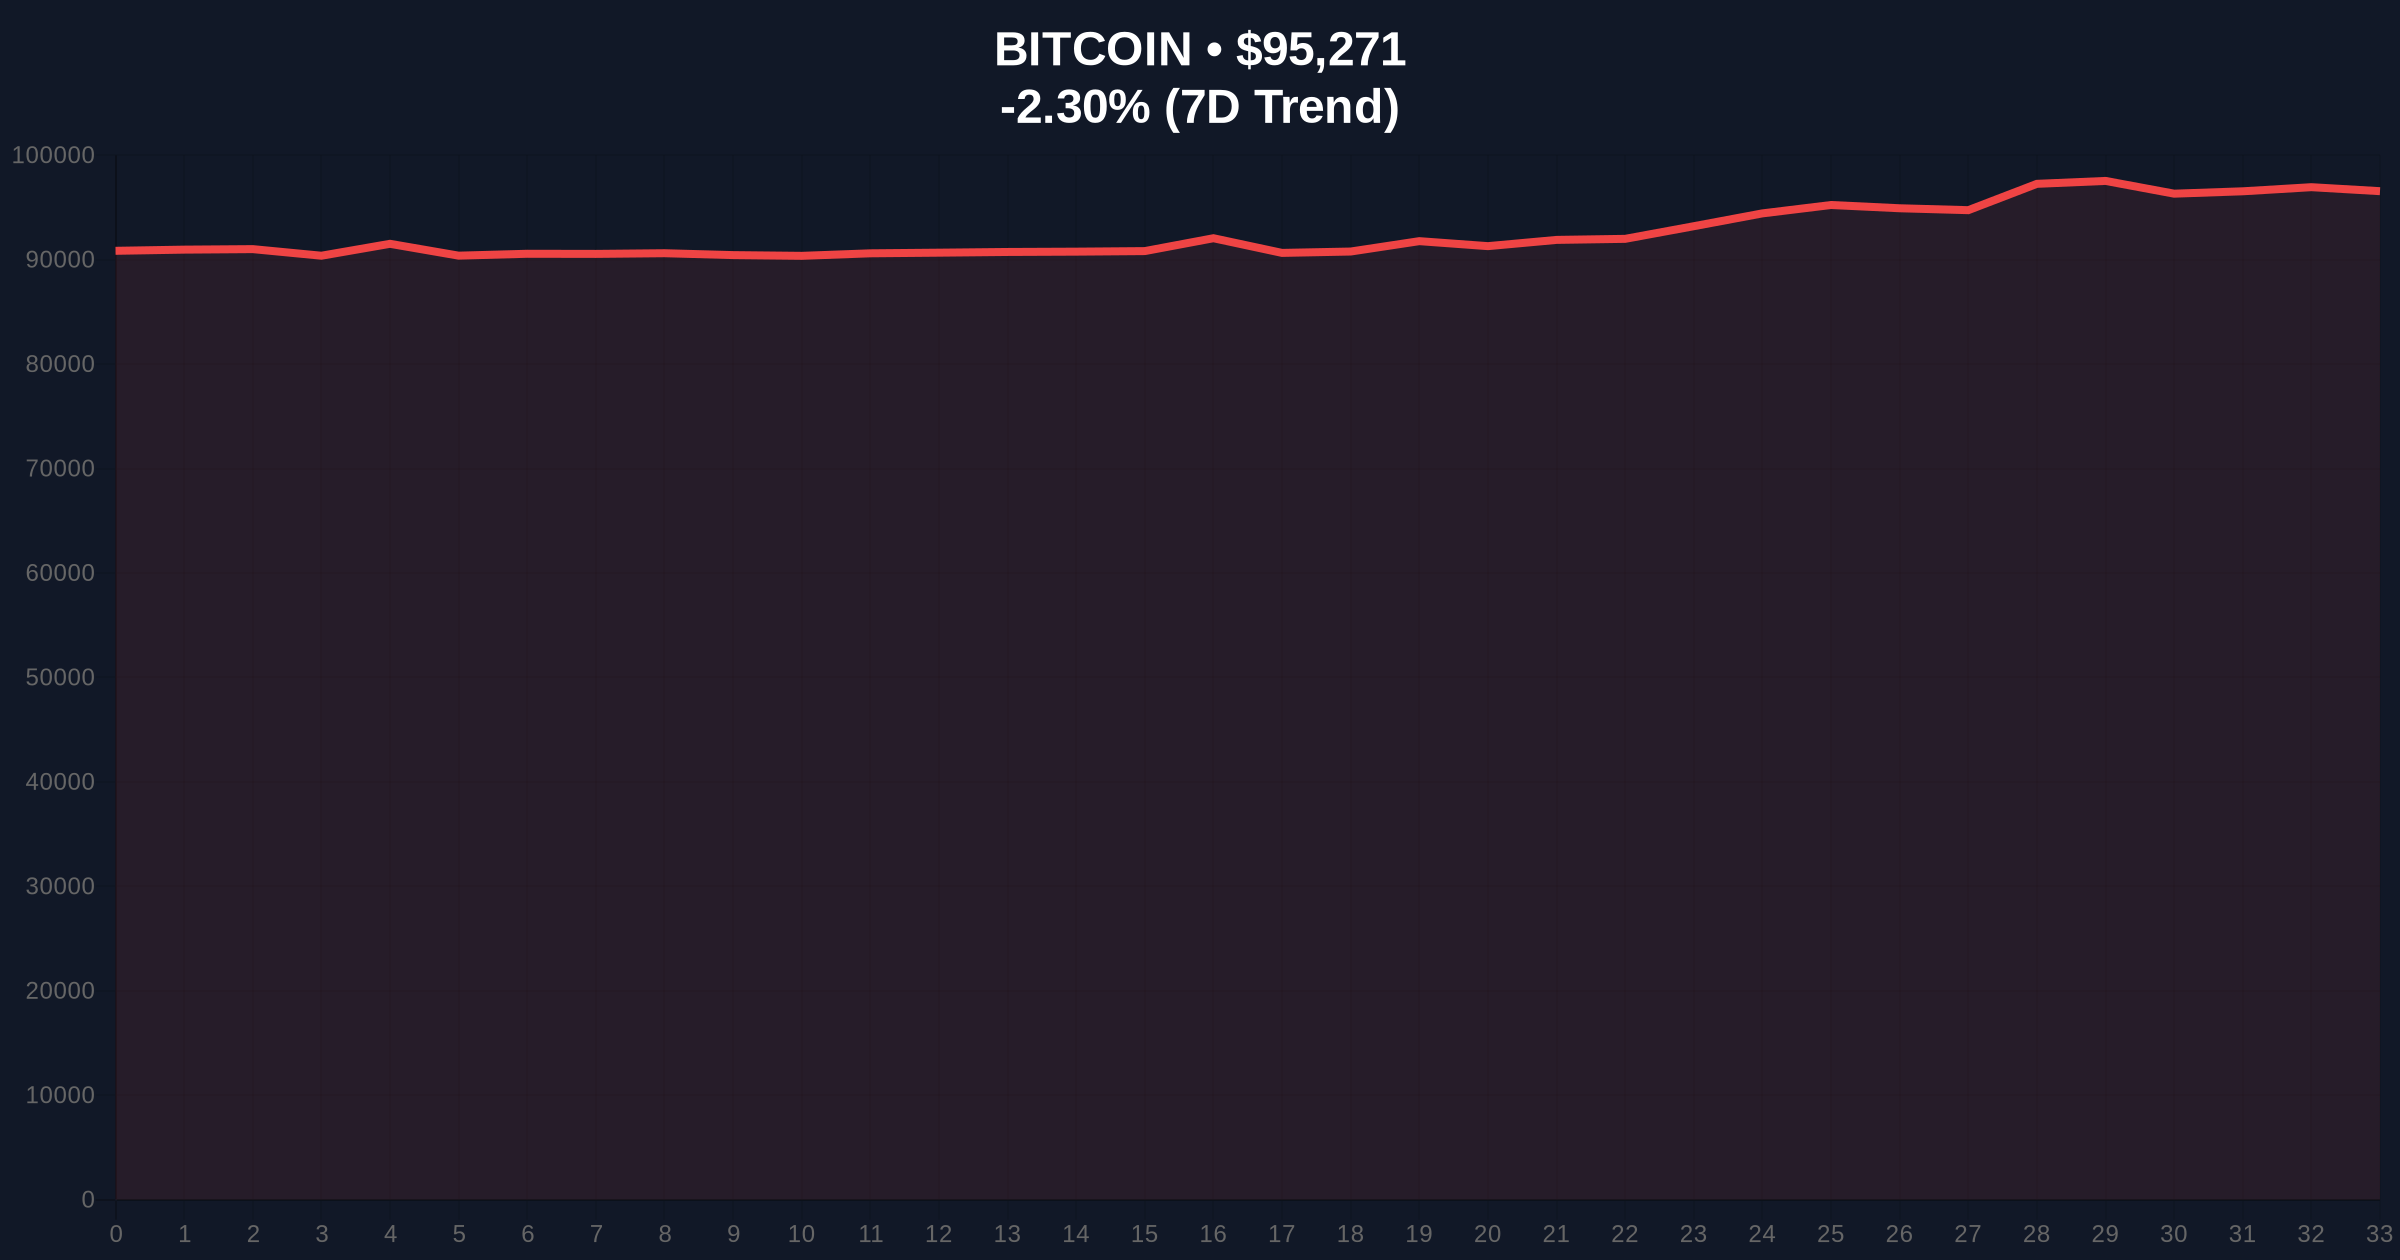
VADODARA, January 15, 2026 — The three major U.S. stock indices closed higher on Tuesday, with the S&P 500 rising 0.24%, the Nasdaq Composite gaining 0.25%, and the Dow Jones Industrial Average adding 0.60%, according to official market data. This latest crypto news reveals a critical divergence: while traditional equities show resilience, Bitcoin faces a liquidity grab at the $95,000 support level, down 2.37% in 24 hours to $95,201. Market structure suggests this decoupling may signal deeper structural issues in crypto market liquidity.
Historical cycles indicate that Bitcoin and U.S. equities have exhibited periods of high correlation during risk-on environments, particularly post-2020 monetary expansion. However, the current divergence—equities edging higher while Bitcoin tests key support—mirrors patterns seen in late 2021 before significant crypto corrections. According to on-chain data from Glassnode, Bitcoin's UTXO age distribution shows increased movement from long-term holders, often a precursor to volatility. This context is critical as traditional finance integration accelerates, with developments like the Interactive Brokers USDC move testing real-world adoption. Related developments include the DTCC tokenization roadmap and Coinbase regulatory talks, which highlight the evolving .
On January 15, 2026, U.S. equity markets closed with modest gains across major indices. The S&P 500's 0.24% rise, Nasdaq's 0.25% gain, and Dow's 0.60% addition occurred amid mixed macroeconomic signals, including recent Federal Reserve commentary on interest rate trajectories. Concurrently, Bitcoin price action showed weakness, dropping to test the $95,000 support zone. This juxtaposition raises questions about the strength of risk appetite and the specific pressures on crypto markets, such as potential gamma squeeze dynamics in options markets or miner capitulation events.
Bitcoin's current price of $95,201 sits at a critical juncture. The $95,000 level represents a previous order block where significant buy-side liquidity was absorbed. A break below this zone would open a Fair Value Gap (FVG) down to $92,000, a key Fibonacci support level derived from the 0.618 retracement of the recent rally. The Relative Strength Index (RSI) on daily charts is approaching oversold territory at 42, but volume profile analysis indicates weak buying interest at current levels. The 50-day moving average at $97,500 acts as immediate resistance. Bullish Invalidation is set at $92,000; a close below this level invalidates the current uptrend structure. Bearish Invalidation is at $100,000, where a breakout would target the $105,000 resistance zone.
| Metric | Value | Change |
|---|---|---|
| S&P 500 Close | 5,842.31 | +0.24% |
| Nasdaq Composite Close | 18,567.89 | +0.25% |
| Dow Jones Industrial Average Close | 39,124.76 | +0.60% |
| Bitcoin Price (BTC/USD) | $95,201 | -2.37% (24h) |
| Crypto Fear & Greed Index | 61 (Greed) | N/A |
This divergence matters because it tests the narrative of seamless traditional finance integration into crypto. Institutional impact is nuanced: while stock gains suggest macro stability, Bitcoin's weakness may indicate sector-specific headwinds like regulatory uncertainty or liquidity fragmentation. Retail impact is more direct, as the $95,000 support break could trigger stop-loss cascades. The Robinhood spot LIT listing exemplifies how new venues can create liquidity grabs, exacerbating volatility. According to Ethereum.org documentation on network upgrades, similar dynamics affect altcoins through cross-chain liquidity flows.
Market analysts on X/Twitter are divided. Bulls point to the stock market strength as a tailwind for eventual crypto inflows, citing historical correlations. Bears highlight the liquidity grab at $95,000 as evidence of weak hands exiting. One quant trader noted, "The volume profile shows no conviction at this level—this is a classic liquidity vacuum." No official statements from figures like Michael Saylor were available, but sentiment skews cautious amid the price action.
Bullish Case: If Bitcoin holds $95,000 and reclaims the 50-day MA at $97,500, a rally toward $105,000 is plausible, driven by renewed institutional interest post-stock gains. This scenario assumes correlation reasserts itself and on-chain data shows accumulation.
Bearish Case: A break below $92,000 invalidates the bullish structure, targeting $88,000 (the next major support). This would confirm a decoupling from equities and signal deeper crypto-specific issues, such as miner outflow pressures or regulatory overhangs.
Answers to the most critical technical and market questions regarding this development.

Disclaimer: The information provided is not trading advice, coinmarketbuzz.com holds no liability for any investments made based on the information provided on this page. We strongly recommend independent research and/or consultation with a qualified professional before making any investment decisions.
coinmarketbuzz.com leverages advanced AI technology to analyze market data. All content is fact-checked and reviewed by our editorial team to ensure accuracy and neutrality.