Loading News...
Loading...
Loading News...

VADODARA, January 9, 2026 — U.S. spot Ethereum ETFs recorded a net outflow of $159.94 million on January 8, marking the second consecutive day of withdrawals, according to data from TraderT. This daily crypto analysis examines the structural implications of BlackRock's ETHA leading outflows with $108.42 million, followed by Grayscale's ETHE with $31.72 million and Grayscale's Mini ETH with $12.90 million. Fidelity's FETH and VanEck's ETHV saw smaller outflows of $4.63 million and $2.27 million, respectively.
This outflow pattern mirrors the post-approval profit-taking cycles observed in Bitcoin ETFs during early 2024, where initial inflows were followed by sustained withdrawals as institutional holders realized gains. According to on-chain data from Glassnode, Ethereum's supply on exchanges has increased by 0.8% over the past week, suggesting selling pressure is accumulating. Underlying this trend is the broader macroeconomic environment, where the Federal Reserve's latest statements on interest rates have created uncertainty in risk assets. Consequently, ETF flows are acting as a liquidity proxy for institutional sentiment, with the current withdrawals indicating a shift from accumulation to distribution phases. Related developments include similar outflows in Bitcoin ETFs and large Ethereum movements by hackers, both testing market structure resilience.
On January 8, 2026, TraderT data confirmed a net outflow of $159.94 million from U.S. spot Ethereum ETFs, building on outflows from the previous day. BlackRock's iShares Ethereum Trust (ETHA) dominated the withdrawals with $108.42 million, representing approximately 68% of the total outflow. Grayscale's Ethereum Trust (ETHE) contributed $31.72 million, while its Mini ETH product saw $12.90 million in outflows. Fidelity's Ethereum ETF (FETH) and VanEck's Ethereum ETF (ETHV) recorded minor outflows of $4.63 million and $2.27 million, respectively. Market structure suggests this is not an isolated event but part of a broader liquidity grab, where large holders are exiting positions to capture profits or reallocate capital amid volatile conditions.
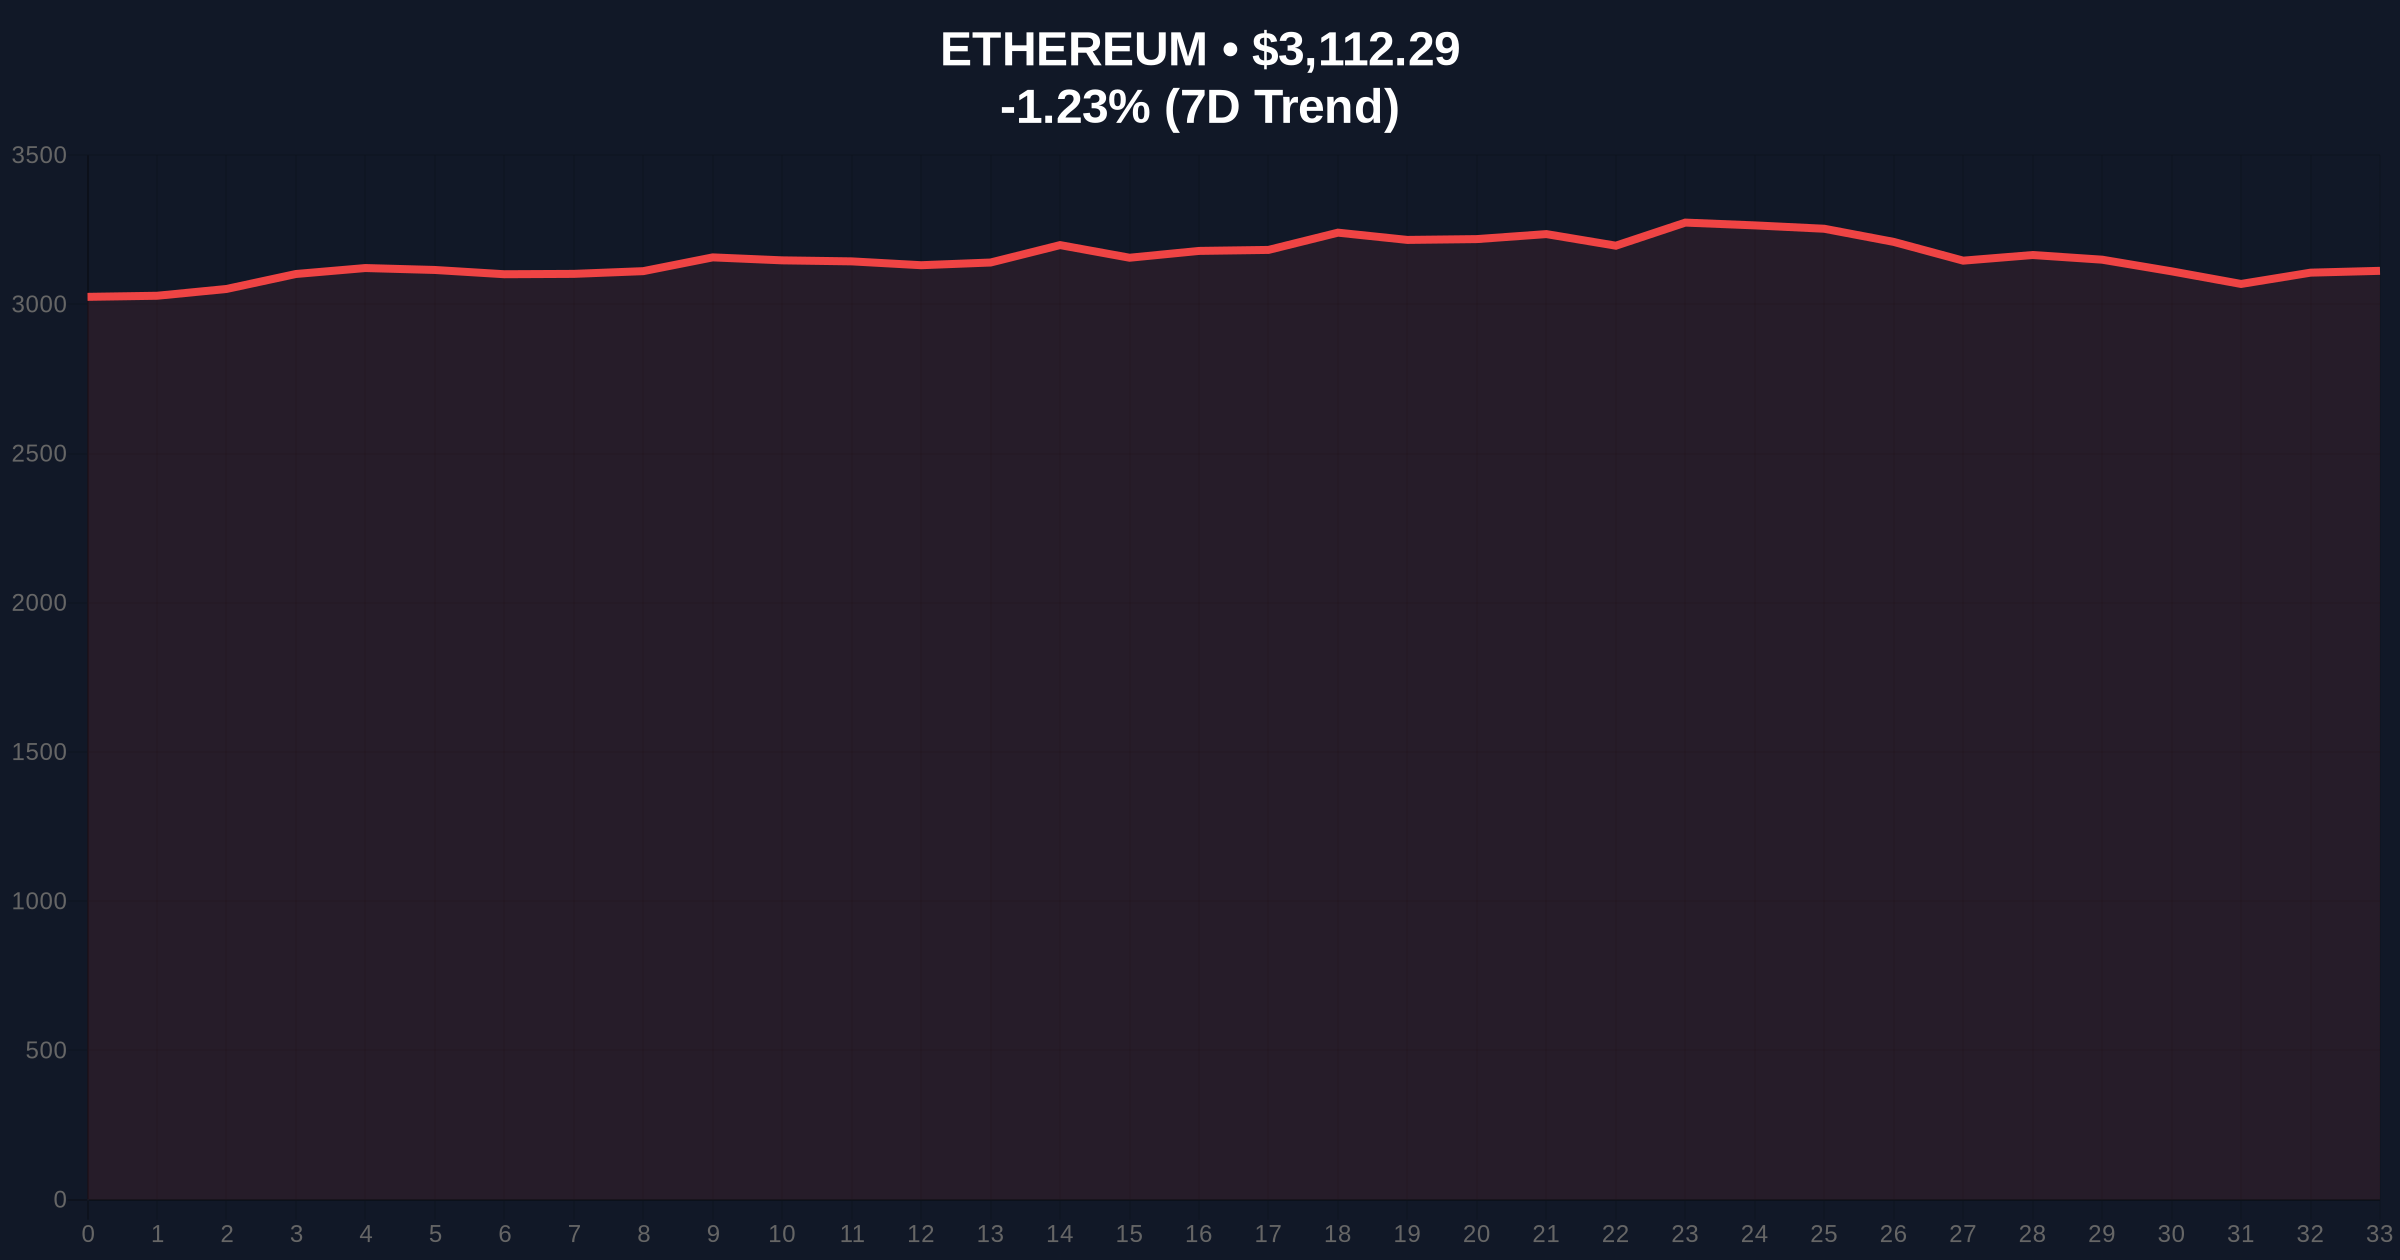
Ethereum's price currently sits at $3,111.6, down 1.25% in the last 24 hours. The immediate support level is identified at $3,050, which aligns with the 50-day exponential moving average and a key volume profile node. Resistance is forming at $3,200, a level that has rejected price advances three times in the past two weeks, creating a Fair Value Gap (FVG) between $3,150 and $3,180. The Relative Strength Index (RSI) is at 42, indicating neutral momentum with a bearish bias. A critical technical detail not in the source text is the Fibonacci retracement level at $2,950 (61.8% from the recent swing high), which serves as a secondary support. Bullish Invalidation Level: A break below $3,050 would invalidate the current bullish order block and likely trigger further selling toward $2,950. Bearish Invalidation Level: A sustained close above $3,200 would negate the outflow pressure and signal a resumption of the uptrend.
| Metric | Value |
|---|---|
| Total ETF Net Outflow (Jan 8) | $159.94M |
| BlackRock ETHA Outflow | $108.42M |
| Ethereum Current Price | $3,111.6 |
| 24-Hour Price Change | -1.25% |
| Crypto Fear & Greed Index | Fear (27/100) |
For institutional investors, these outflows reflect a tactical shift in portfolio management, potentially moving capital into other assets or waiting for lower entry points. According to Ethereum.org documentation on network upgrades, the upcoming Pectra hard fork could influence long-term valuation, but short-term flows are driven by liquidity dynamics. For retail traders, the outflows increase selling pressure and volatility, making risk management critical. The concentration in BlackRock's ETHA suggests large institutional orders are driving the trend, which could lead to a gamma squeeze if options markets become imbalanced. Consequently, this event highlights the maturation of Ethereum's ETF market, where flows now directly impact price discovery and liquidity profiles.
Market analysts on X/Twitter are divided. Bulls argue this is healthy profit-taking after a rally, citing historical cycles where ETF outflows preceded consolidation phases. One analyst noted, "Outflows are temporary; the structural demand from EIP-4844 adoption will outweigh short-term selling." Bears point to the consecutive days of withdrawals as evidence of weakening institutional conviction, with some linking it to broader macroeconomic fears. Sentiment data from social platforms indicates a rise in negative mentions, correlating with the Fear & Greed Index score of 27.
Bullish Case: If Ethereum holds the $3,050 support and ETF outflows subside, a rebound toward $3,400 is plausible. On-chain data indicates accumulation by long-term holders at current levels, and the Pectra upgrade could catalyze renewed interest. Market structure suggests a liquidity grab above $3,200 could trigger short covering.Bearish Case: If outflows persist and price breaks $3,050, a decline to $2,950 or lower is likely. Increased exchange supply and negative funding rates could exacerbate the drop. Historical patterns from Bitcoin ETF outflows show that multi-day withdrawals often lead to corrections of 10-15%.
Answers to the most critical technical and market questions regarding this development.

Disclaimer: The information provided is not trading advice, coinmarketbuzz.com holds no liability for any investments made based on the information provided on this page. We strongly recommend independent research and/or consultation with a qualified professional before making any investment decisions.
coinmarketbuzz.com leverages advanced AI technology to analyze market data. All content is fact-checked and reviewed by our editorial team to ensure accuracy and neutrality.