Loading News...
Loading...
Loading News...

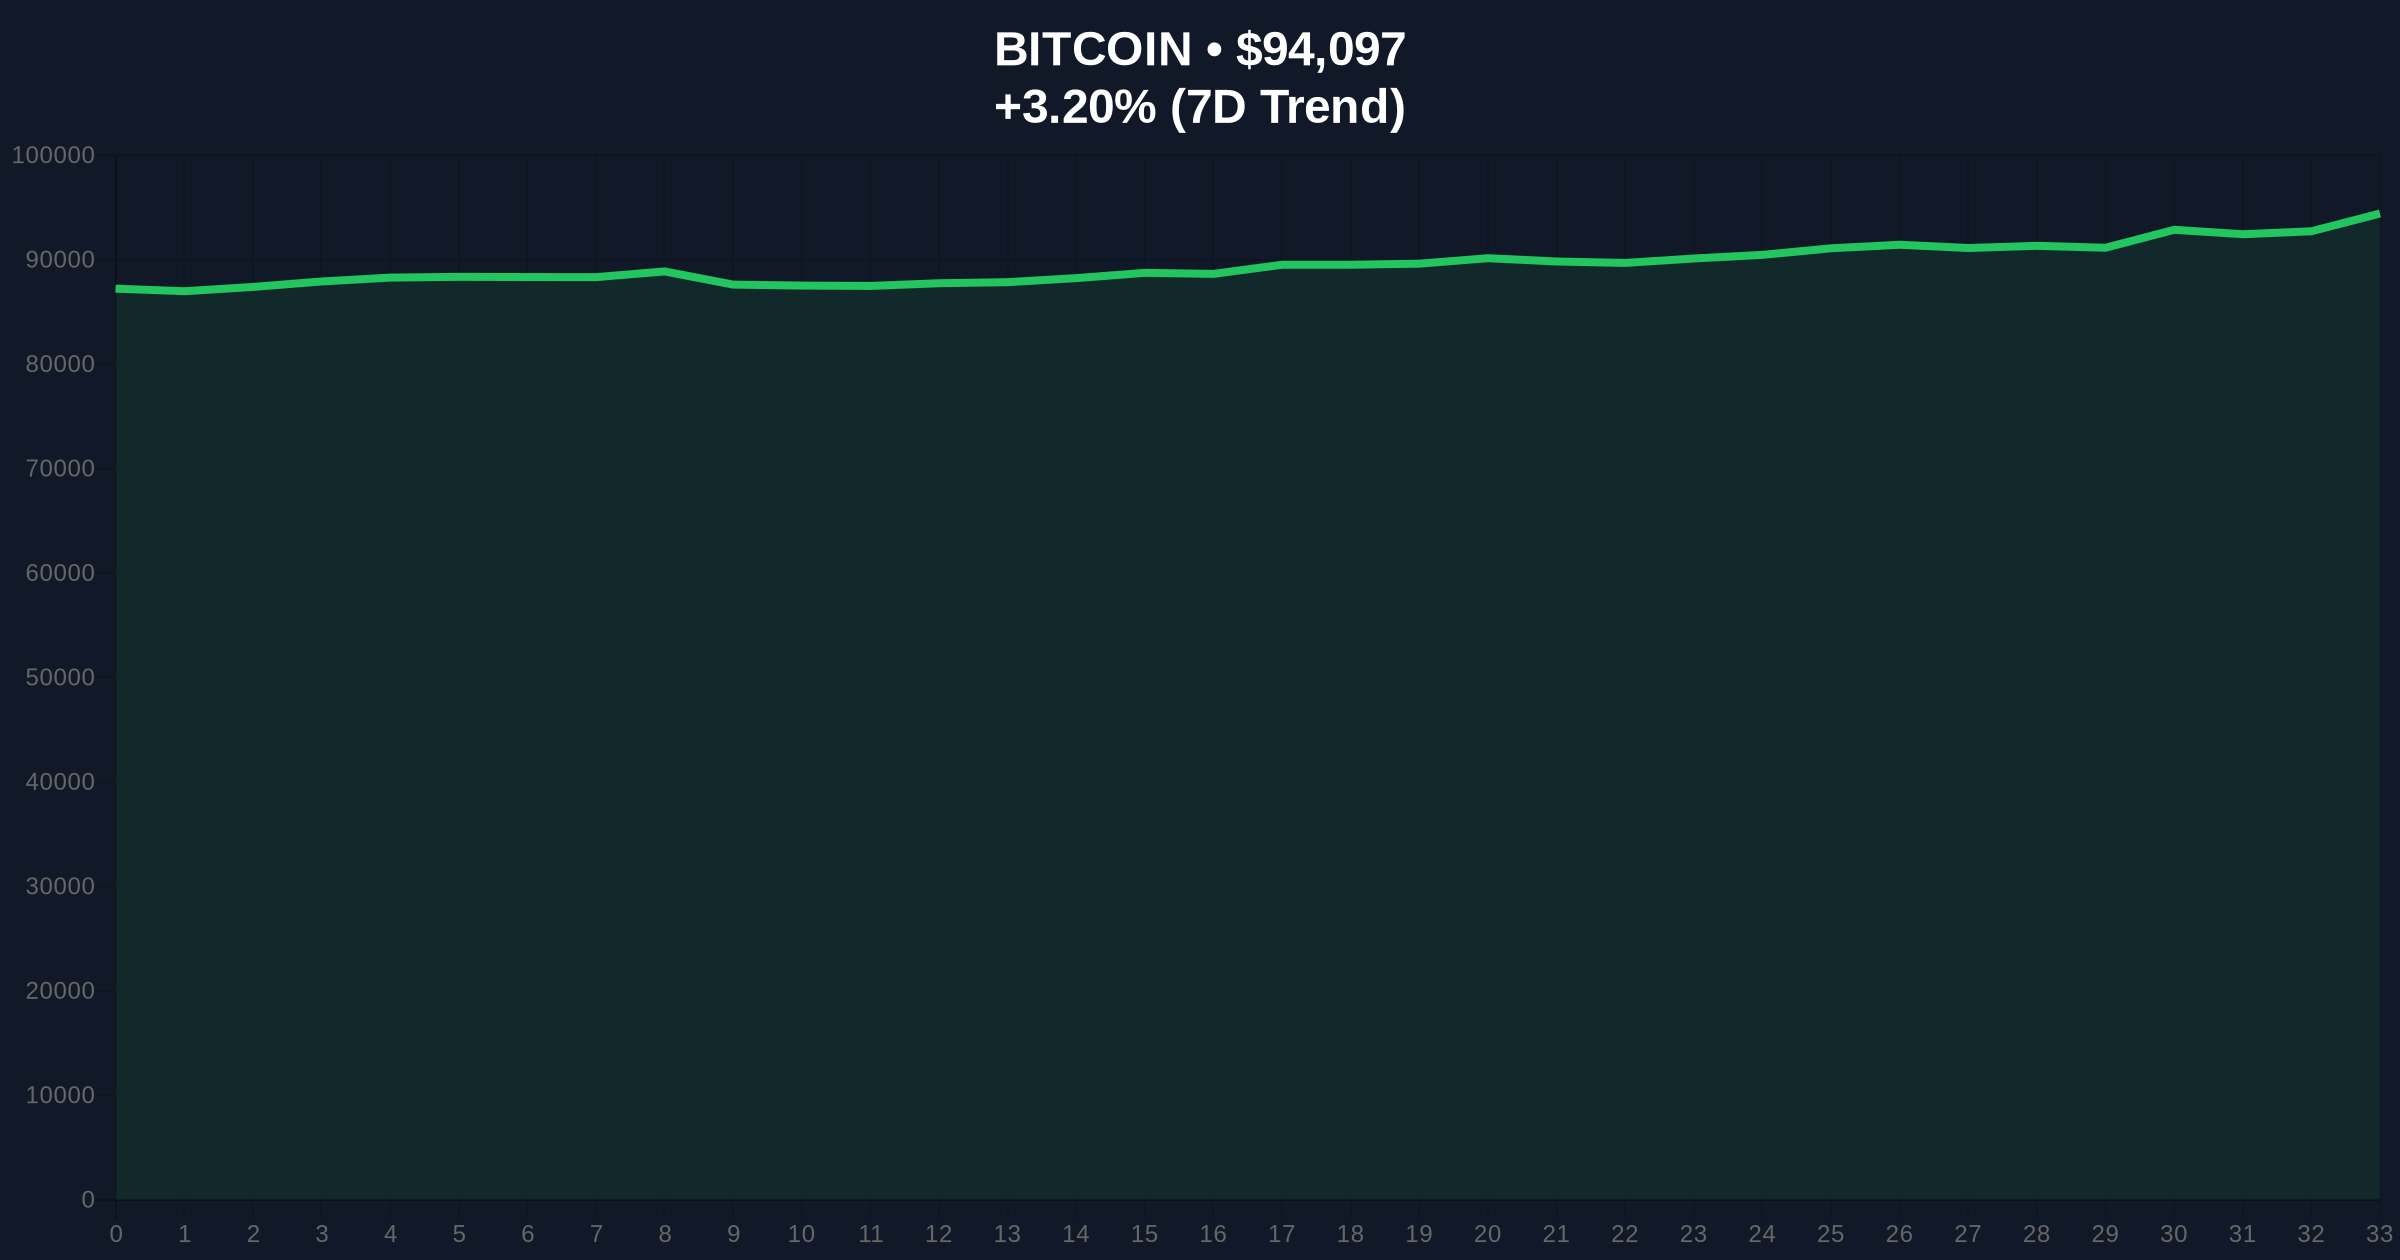
VADODARA, January 5, 2026 — According to Bloomberg ETF analyst James Seyffart, inflow and outflow data from U.S. spot Bitcoin ETFs serve as a pure indicator of market sentiment, offering a clearer signal than traditional metrics. This daily crypto analysis examines whether this claim holds under quantitative scrutiny as Bitcoin trades at $94,098 with a Fear & Greed Index reading of 26/100.
Since the SEC approved spot Bitcoin ETFs in January 2024, market participants have sought reliable metrics to gauge institutional adoption. Assets Under Management (AUM) has been the default metric, but its correlation with Bitcoin's price creates distortion. Historical cycles suggest that during the 2021 bull run, AUM figures were inflated by price appreciation rather than net capital inflows, creating misleading signals about actual market participation. The current environment mirrors patterns seen during the 2022 bear market, where net outflows preceded significant price declines. Related developments include recent whale accumulation patterns that contrast with retail selling, highlighting divergent market behaviors.
On January 5, 2026, Bloomberg ETF analyst James Seyffart stated in a report that net flow figures from U.S. spot Bitcoin ETFs track the actual movement of BTC into and out of funds, making them a direct measure of market activity. According to the analyst, unlike AUM—which can be distorted by price fluctuations—flow data provides a purer indicator of sentiment. This analysis follows Bitcoin's 3.20% gain over 24 hours to $94,098, amid broader market fear conditions. The statement was made without specific flow numbers, raising questions about data transparency and methodology.
Market structure suggests Bitcoin is testing a critical Fair Value Gap (FVG) between $92,000 and $95,000, created during last week's volatility. The current price action at $94,098 sits near the upper boundary of this gap, indicating potential resistance. The 50-day moving average at $91,500 provides dynamic support, while the Relative Strength Index (RSI) at 58 shows neutral momentum without overbought conditions. Volume profile analysis reveals significant liquidity clusters at $90,000 and $96,000, suggesting these levels may act as magnets for price movement. Bullish invalidation is set at $89,500, where a break would signal failure of the current uptrend structure. Bearish invalidation stands at $97,200, above which short positions would be invalidated.
| Metric | Value | Significance |
|---|---|---|
| Crypto Fear & Greed Index | 26/100 (Fear) | Extreme fear suggests potential buying opportunity |
| Bitcoin Current Price | $94,098 | Testing FVG resistance |
| 24-Hour Price Change | +3.20% | Short-term bullish momentum |
| Market Rank | #1 | Dominance remains intact |
| Critical Support Level | $92,000 | Key Fibonacci 0.618 retracement |
For institutional investors, clean flow data reduces noise in sentiment analysis, allowing for more precise positioning. The SEC's official guidance on ETF reporting standards, available at SEC.gov, emphasizes transparency in flow metrics, though implementation varies. Retail traders, however, often lack access to real-time flow data, creating an information asymmetry that can be exploited by sophisticated players. If ETF flows truly reflect pure sentiment, they could become a leading indicator for price movements, similar to how options gamma squeezes have predicted volatility in traditional markets.
Market analysts on X/Twitter are divided. Some echo Seyffart's view, noting that "net flows cut through the price noise," while others question whether ETF data captures the full market picture, given off-exchange OTC activity. The absence of specific flow figures in the report has led to skepticism about the claim's empirical basis. This contrasts with sentiment around recent Layer 2 outages, where on-chain data provided concrete evidence of network stress.
Bullish Case: If ETF flows show sustained net inflows above $500 million weekly, and Bitcoin holds above the $92,000 support, price could target $100,000 by Q1 2026. This scenario assumes the Fear & Greed Index rebounds from extreme fear, and institutional adoption accelerates as outlined in Ethereum's official Pectra upgrade documentation regarding institutional infrastructure.
Bearish Case: If flows turn negative or remain flat, and Bitcoin breaks below $89,500 (bullish invalidation), a retest of $85,000 becomes likely. This would align with historical patterns where ETF outflows preceded corrections of 15-20%. Macro factors, such as those hinted in recent energy market shifts, could exacerbate downside pressure.
Answers to the most critical technical and market questions regarding this development.

Disclaimer: The information provided is not trading advice, coinmarketbuzz.com holds no liability for any investments made based on the information provided on this page. We strongly recommend independent research and/or consultation with a qualified professional before making any investment decisions.
coinmarketbuzz.com leverages advanced AI technology to analyze market data. All content is fact-checked and reviewed by our editorial team to ensure accuracy and neutrality.