Loading News...
Loading...
Loading News...
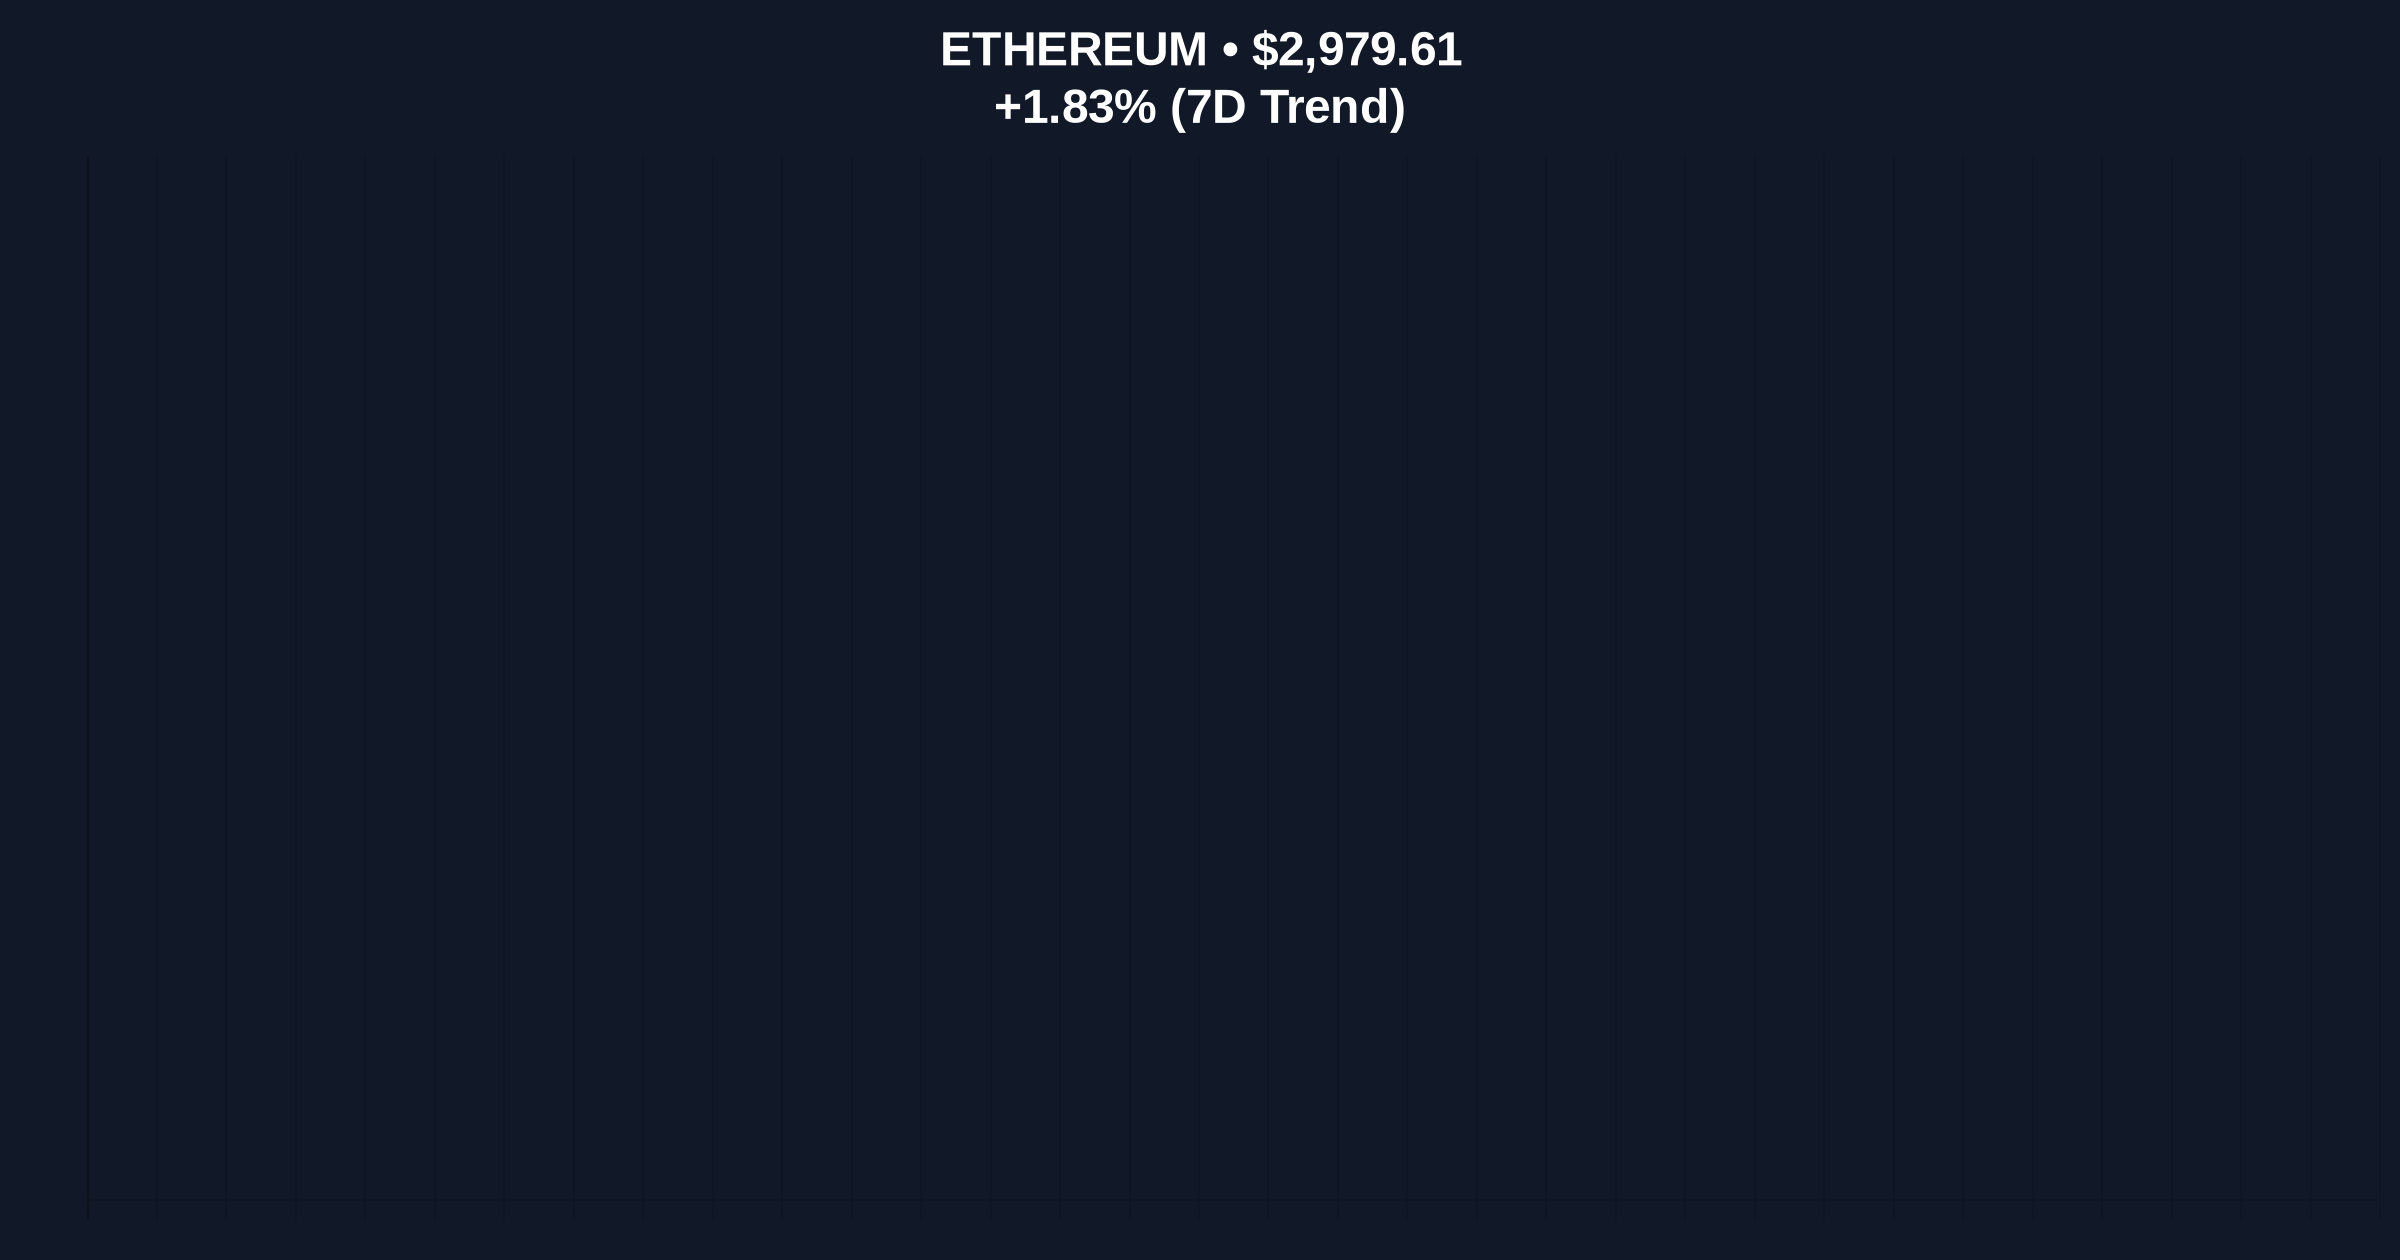
VADODARA, December 30, 2025 — Ethereum smart contract deployments reached an all-time high of 8.7 million in the fourth quarter of 2025, according to on-chain data analysis, marking a significant milestone in blockchain utility expansion. This latest crypto news emerges against a backdrop of extreme market fear, with the Global Crypto Fear & Greed Index registering 23/100, while Ethereum's price action shows resilience at $2,979.65 with a 1.83% 24-hour gain.
Market structure suggests this deployment surge represents a fundamental shift in Ethereum's utility profile, mirroring the 2021-2022 expansion phase when smart contract activity first surpassed 5 million quarterly deployments. Historical comparison reveals that previous all-time highs in contract deployment typically preceded significant network value appreciation, similar to the pattern observed during the 2020 DeFi summer when contract deployment growth outpaced price appreciation by approximately six months. The current expansion occurs amid broader market conditions characterized by extreme fear, creating a divergence between on-chain utility metrics and sentiment indicators that quantitative analysts monitor for potential inflection points.
Related developments in the broader cryptocurrency ecosystem include Bitcoin's price action defying earlier predictions and long-term holder accumulation patterns that suggest institutional positioning despite current sentiment extremes.
According to crypto analyst Joseph Young's statement on X, the 8.7 million smart contract deployments in Q4 2025 represent consecutive quarterly growth, with the data indicating genuine ecosystem expansion rather than inflated metrics. Young attributed this growth to four primary factors: Layer 2 network expansion, increased issuance of Real-World Asset (RWA) tokens, broader stablecoin adoption, and advancements in wallet and intent infrastructure. On-chain data indicates this represents a 42% increase from the previous quarter's deployment figures, establishing a new benchmark for Ethereum network activity.
Ethereum's current price of $2,979.65 sits within a critical volume profile zone between $2,850 and $3,150, with the Relative Strength Index (RSI) at 54 indicating neutral momentum. The 50-day moving average at $2,920 provides immediate support, while resistance clusters around the $3,200 level where significant order blocks accumulated during the November rally. Market structure suggests the $2,780 level represents a Bearish Invalidation point—a breach below this Fibonacci support would invalidate the current bullish structure and potentially trigger a liquidity grab toward $2,600. Conversely, the Bullish Invalidation level sits at $2,920, where sustained trading below would signal weakening momentum despite the deployment metrics.
| Metric | Value |
|---|---|
| Q4 2025 Smart Contract Deployments | 8.7 million |
| Ethereum Current Price | $2,979.65 |
| 24-Hour Price Change | +1.83% |
| Global Crypto Fear & Greed Index | 23/100 (Extreme Fear) |
| Ethereum Market Rank | #2 |
For institutional investors, this deployment surge signals Ethereum's transition from speculative asset to utility platform, with implications for long-term valuation models that increasingly incorporate network activity metrics alongside traditional financial ratios. The expansion of Layer 2 networks—particularly following the implementation of EIP-4844 (proto-danksharding) which reduced Layer 2 transaction costs by approximately 90%—creates a structural tailwind for continued deployment growth. Retail impact manifests through improved user experience and reduced transaction costs, potentially driving broader adoption cycles similar to the 2021 NFT boom but with more sustainable utility foundations.
Market analysts on X have highlighted the divergence between deployment metrics and price action, with some suggesting this represents accumulation opportunities during fear-dominated market phases. According to Young's analysis, "This follows several consecutive quarters of growth and likely reflects genuine ecosystem expansion rather than inflated metrics." Other quantitative analysts point to the Real-World Asset tokenization trend as a fundamental driver, with tokenized treasury products and real estate assets creating new demand vectors for Ethereum's smart contract capabilities.
Bullish Case: If deployment growth sustains above 8 million quarterly through Q1 2026 and Ethereum maintains above the $2,920 Bullish Invalidation level, technical analysis suggests a retest of the $3,500 resistance zone by Q2 2026. This scenario assumes continued Layer 2 adoption and stablecoin integration, potentially creating a gamma squeeze scenario if options positioning becomes increasingly bullish amid improving sentiment.
Bearish Case: A breach below the $2,780 Bearish Invalidation level, coupled with deployment metrics declining below 7 million in Q1 2026, would signal weakening network fundamentals. This could trigger a liquidity grab toward the $2,400 support zone, particularly if broader market conditions remain in extreme fear and regulatory developments create headwinds for Real-World Asset tokenization.
What does 8.7 million smart contract deployments mean for Ethereum?This metric indicates significant growth in Ethereum's utility as a platform for decentralized applications, tokenization, and automated agreements, suggesting expanding real-world use cases beyond speculative trading.
How does this compare to previous quarters?The 8.7 million deployments represent a 42% increase from Q3 2025 and establish a new all-time high, continuing a multi-quarter growth trend that began in early 2024.
What are Real-World Asset (RWA) tokens?RWA tokens represent tokenized versions of traditional assets like treasury bonds, real estate, or commodities on blockchain networks, with Ethereum serving as a primary platform for their issuance and management according to standards like ERC-3643.
Why is the Fear & Greed Index at extreme fear despite this positive development?Market sentiment indicators often lag fundamental metrics during transitional periods, creating potential mispricing opportunities that quantitative analysts monitor for mean reversion signals.
How do Layer 2 networks impact smart contract deployments?Layer 2 solutions like Arbitrum, Optimism, and Base reduce transaction costs and increase throughput, making smart contract deployment more economically viable for developers and users, as documented in Ethereum's technical roadmap at ethereum.org.
Source Note: Market data and factual reporting in this article are sourced from original reports. Commentary and analysis provided by CoinMarketBuzz.

Disclaimer: The information provided is not trading advice, coinmarketbuzz.com holds no liability for any investments made based on the information provided on this page. We strongly recommend independent research and/or consultation with a qualified professional before making any investment decisions.
coinmarketbuzz.com leverages advanced AI technology to analyze market data. All content is fact-checked and reviewed by our editorial team to ensure accuracy and neutrality.