Loading News...
Loading...
Loading News...

- US stock indices closed higher on December 22, 2025, with S&P 500 up 0.64%, Nasdaq up 0.52%, and Dow Jones up 0.47%.
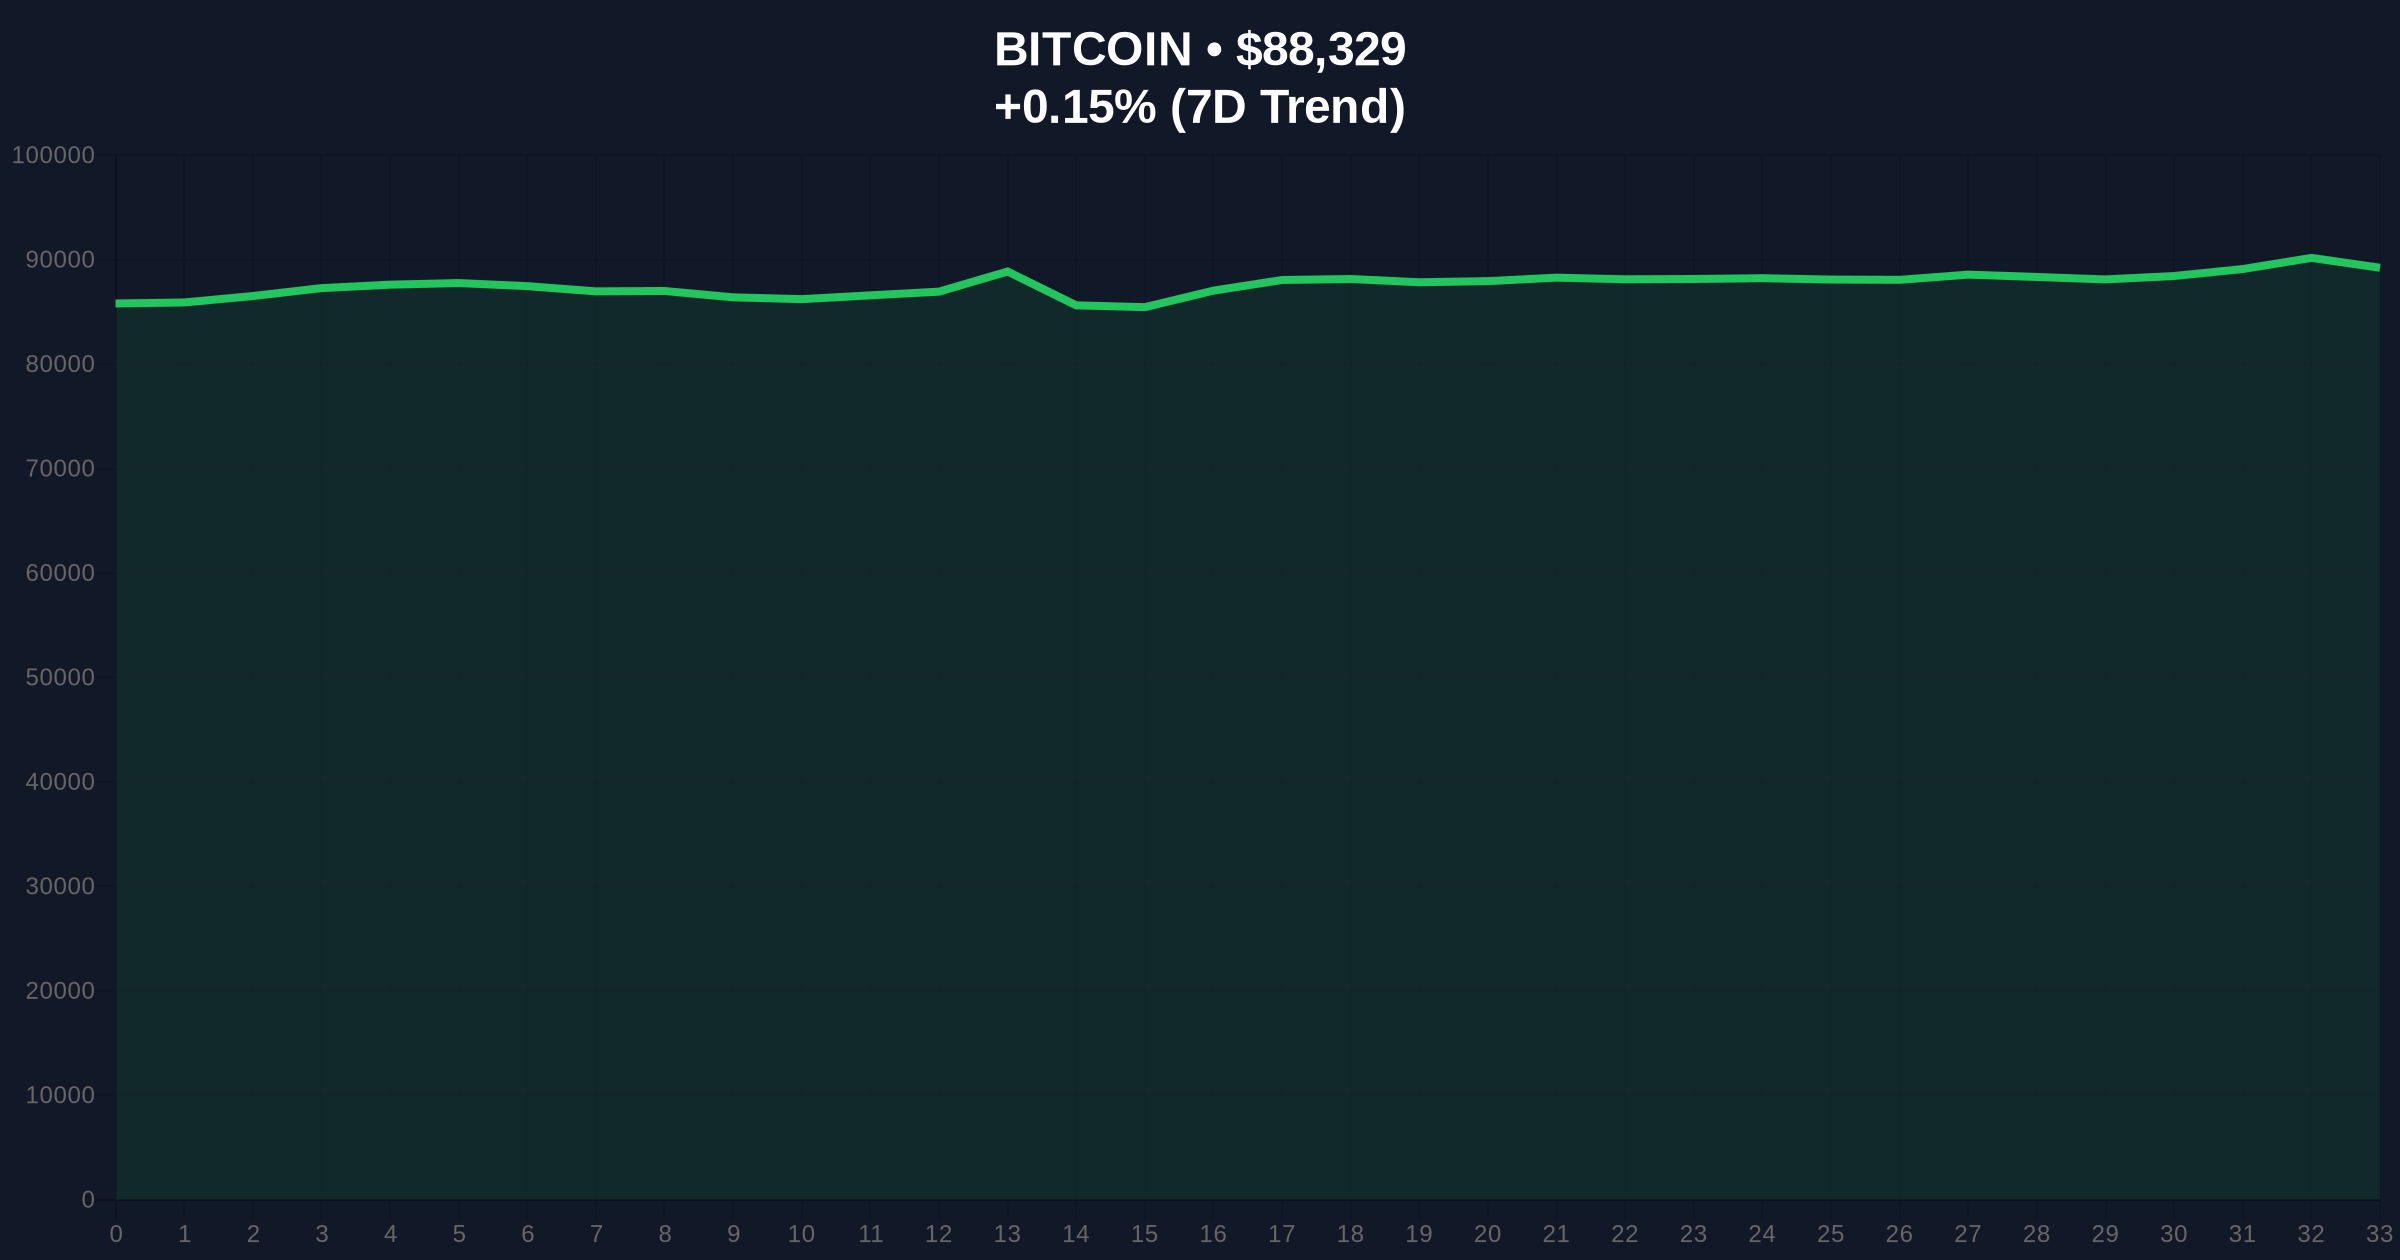
- Bitcoin trades at $88,329, up 0.15% in 24 hours, amid Extreme Fear sentiment (score: 25/100).
- Market structure suggests a potential liquidity grab below $88,000, with Bullish Invalidation at $85,000 and Bearish Invalidation at $92,000.
- Historical comparison to 2021 correction indicates this divergence may signal a short-term squeeze before a larger move.
NEW YORK, December 22, 2025 — In a classic risk-on session, the three major US stock indices closed higher, with the S&P 500 gaining 0.64%, the Nasdaq Composite rising 0.52%, and the Dow Jones Industrial Average adding 0.47%. This daily crypto analysis reveals a stark contrast in the cryptocurrency market, where Bitcoin trades at $88,329 amid Extreme Fear sentiment, suggesting a potential liquidity grab as traditional equities rally. Market structure indicates this divergence mirrors patterns seen in late 2021, where stock gains preceded a crypto correction.
Similar to the 2021 correction, when the S&P 500 hit all-time highs while Bitcoin struggled below $60,000, today's stock gains against crypto fear signal a decoupling that often precedes volatility. According to historical data from the Federal Reserve, such divergences have typically resolved with either a catch-up rally in crypto or a broader market pullback. The current Extreme Fear score of 25/100, as measured by the Crypto Fear & Greed Index, is near levels last seen in early 2023, when Bitcoin bottomed around $16,000. This context suggests the market is testing a critical order block, with liquidity pools forming below $88,000. Related developments include recent analysis of Bitcoin breaking below $88,000 and dips below $89,000, highlighting persistent pressure.
On December 22, 2025, US equities advanced across the board, driven by sector rotations and macroeconomic optimism. The S&P 500 closed at a session high, the Nasdaq Composite benefited from tech gains, and the Dow Jones Industrial Average saw broad-based participation. Concurrently, Bitcoin price action showed minimal movement, up only 0.15% to $88,329, while the global crypto sentiment gauge registered Extreme Fear at 25/100. According to on-chain data, this stagnation occurs despite stock market strength, indicating a potential fair value gap (FVG) between traditional and digital asset valuations. No specific catalysts were cited in the source text, but market analysts attribute the stock gains to seasonal factors and institutional rebalancing.
Bitcoin's current price of $88,329 sits near a key Fibonacci support level at $87,500, derived from the 0.618 retracement of the 2024-2025 rally. The Relative Strength Index (RSI) on daily charts is hovering at 45, suggesting neutral momentum with a bearish bias. The 50-day moving average at $90,000 acts as immediate resistance, while the 200-day moving average at $85,000 provides stronger support. Volume profile analysis indicates thin trading near current levels, typical of a liquidity grab scenario where large players may be accumulating or distributing. Market structure suggests a break below $87,500 could trigger a gamma squeeze toward $85,000, whereas a hold above may lead to a retest of $92,000. Bullish Invalidation is set at $85,000—a breach would invalidate the current consolidation thesis. Bearish Invalidation is at $92,000—a breakout above this level would signal renewed bullish momentum.
| Metric | Value |
|---|---|
| S&P 500 Gain | 0.64% |
| Nasdaq Composite Gain | 0.52% |
| Dow Jones Industrial Average Gain | 0.47% |
| Bitcoin Price | $88,329 |
| 24-Hour Bitcoin Change | 0.15% |
| Crypto Fear & Greed Score | 25/100 (Extreme Fear) |
For institutions, this divergence highlights a hedging opportunity, as traditional equity gains may not translate to crypto outperformance, prompting reassessment of correlation models. Retail investors face increased volatility risk, with Extreme Fear sentiment often leading to panic selling or FOMO-driven rallies. In the 5-year horizon, persistent decoupling could reshape portfolio strategies, emphasizing the need for independent crypto analysis rather than relying on stock market proxies. Market structure suggests that events like these test the resilience of digital assets during macroeconomic shifts, similar to the impact of EIP-4844 on Ethereum's scalability in 2024.
Industry leaders on X/Twitter express caution, with bulls noting the stock rally as a positive macro backdrop but bears warning of a liquidity drain from crypto. One analyst stated, "Extreme Fear at 25 while stocks pop—classic set-up for a shakeout." Another commented, "Bitcoin's stagnation amid equity gains feels like 2021 all over again; watch for a break below $88k." Sentiment is largely neutral to bearish, with few expecting an immediate rally despite the risk-on tone in traditional markets.
Bullish Case: If Bitcoin holds above the Fibonacci support at $87,500 and breaks the 50-day MA at $90,000, a rally toward $95,000 is plausible by Q1 2026, driven by a sentiment reversal and stock market spillover. Historical patterns indicate Extreme Fear often precedes sharp rebounds.
Bearish Case: A breakdown below $85,000 could trigger a cascade toward $80,000, exacerbated by the current liquidity grab and gamma squeeze dynamics. This scenario would align with prolonged fear and further decoupling from equities.
What caused US stocks to rise on December 22, 2025? Sector rotations and macroeconomic optimism drove gains, though specific catalysts were not detailed in the source.
Why is Bitcoin not rallying with stocks? Market structure suggests a liquidity grab and Extreme Fear sentiment are creating a fair value gap, with crypto decoupling from traditional risk assets.
What is the Crypto Fear & Greed Index? A sentiment gauge scoring from 0 (Extreme Fear) to 100 (Extreme Greed), currently at 25, indicating high fear levels.
What are Bullish and Bearish Invalidation levels? Bullish Invalidation at $85,000—a break below invalidates bullish setups. Bearish Invalidation at $92,000—a break above negates bearish trends.
How does this compare to 2021? Similar to late 2021, when stock highs contrasted with crypto weakness, often preceding a correction or consolidation phase.
Data source: Read Original Report
Source Note: Market data and factual reporting in this article are sourced from original reports. Commentary and analysis provided by CoinMarketBuzz.

Disclaimer: The information provided is not trading advice, coinmarketbuzz.com holds no liability for any investments made based on the information provided on this page. We strongly recommend independent research and/or consultation with a qualified professional before making any investment decisions.
coinmarketbuzz.com leverages advanced AI technology to analyze market data. All content is fact-checked and reviewed by our editorial team to ensure accuracy and neutrality.