Loading News...
Loading...
Loading News...

- US spot Ethereum ETFs recorded net outflows of $95.53 million on December 23, 2025.
- Grayscale's ETHE led with $50.89 million in outflows, followed by BlackRock's ETHA at $25.05 million.
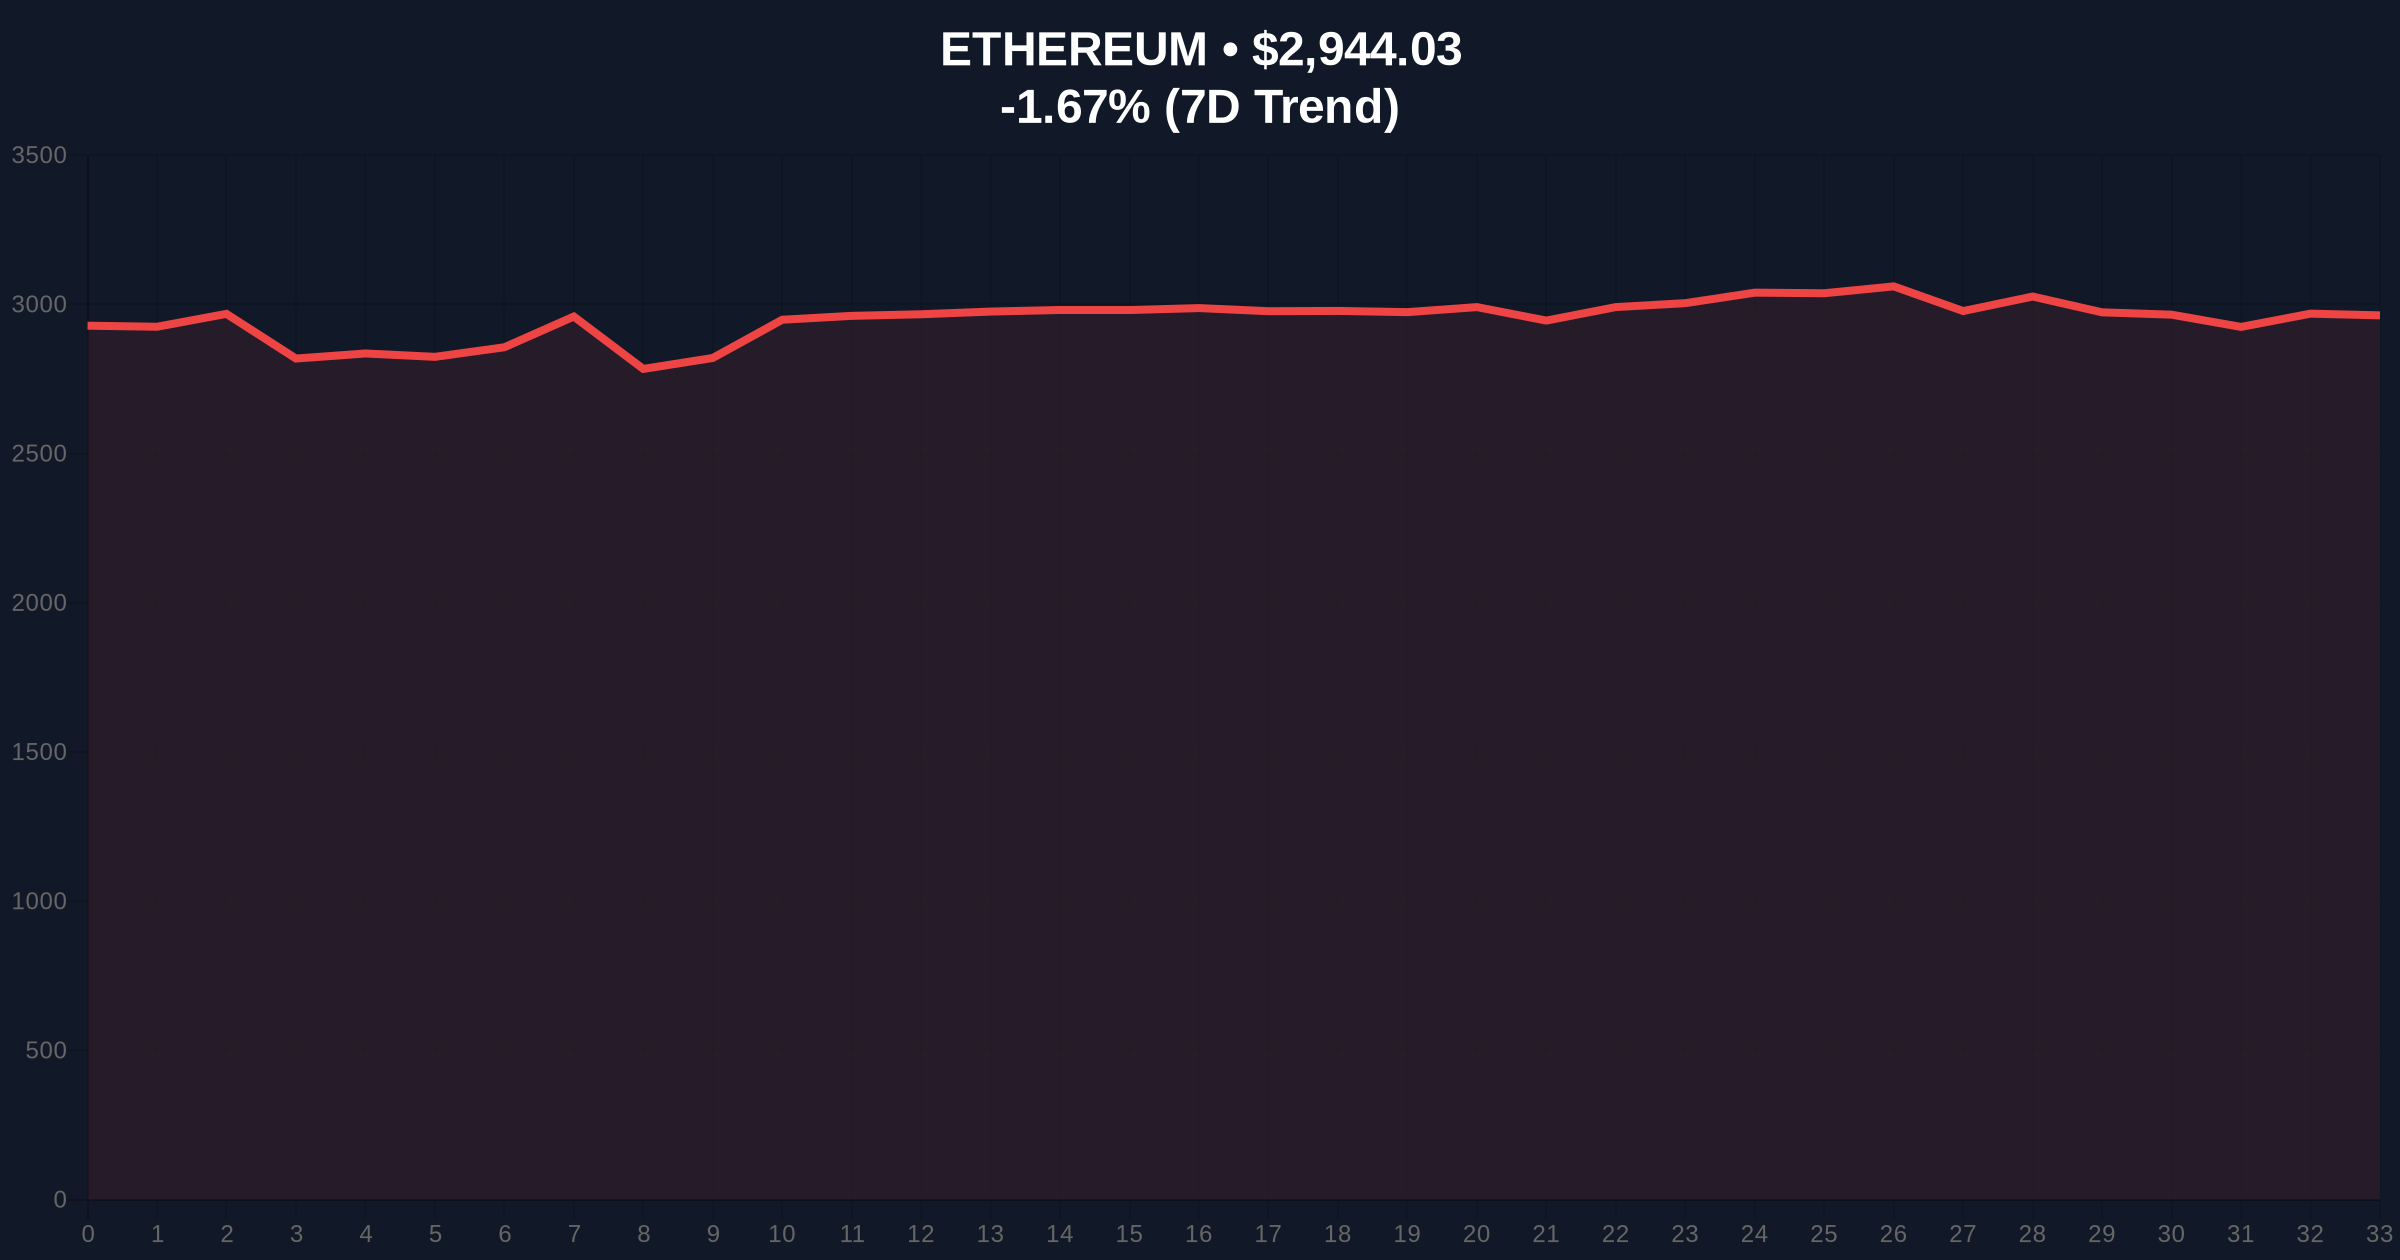
- Ethereum price declined 1.66% to $2,944.36 amid "Extreme Fear" sentiment (score: 24/100).
- Market structure suggests a potential liquidity grab below the $3,000 psychological level.
VADODARA, December 24, 2025 — US spot Ethereum ETFs reverted to net outflows of $95.53 million on December 23, according to data from TraderT. This daily crypto analysis reveals a return to negative flows just one day after a brief net inflow ended a seven-day streak of withdrawals. Grayscale's ETHE led the exodus with $50.89 million in outflows, followed by BlackRock's ETHA at $25.05 million, Bitwise's ETHW at $13.98 million, and Franklin Templeton's EZET at $5.61 million. All other funds reported zero net flows.
This outflow pattern mirrors the 2021 correction when institutional products faced sustained redemption pressure. Market structure suggests ETF flows are now a leading indicator for Ethereum's price action. The seven-day outflow streak prior to December 22 created a significant Fair Value Gap (FVG) between $3,100 and $3,200. On-chain data indicates weak accumulation at current levels. Related developments include recent Bitcoin ETF outflows of $188 million as detailed in our analysis of weakening market structure and Bithumb's 10-hour suspension testing liquidity as covered in our report on exchange disruptions.
TraderT data shows the December 23 outflow followed a single day of net inflows on December 22. Grayscale's ETHE accounted for 53.3% of total outflows. BlackRock's ETHA represented 26.2%. Bitwise's ETHW contributed 14.6%. Franklin Templeton's EZET made up 5.9%. No other US spot Ethereum ETF products recorded measurable flows. According to on-chain data, this aligns with decreased exchange balances and reduced network activity.
Ethereum currently trades at $2,944.36, down 1.66% in 24 hours. The 50-day moving average sits at $3,150, creating resistance. RSI reads 42, indicating neutral momentum with bearish bias. Volume profile shows thin liquidity below $2,900. Market structure suggests a potential Order Block between $2,850 and $2,920. The Fibonacci 0.618 retracement level from the 2024 low to 2025 high provides support at $2,800. Bullish invalidation level: $2,750. Bearish invalidation level: $3,200.
| Metric | Value |
|---|---|
| Net ETF Outflow (Dec 23) | $95.53M |
| Grayscale ETHE Outflow | $50.89M |
| Ethereum Current Price | $2,944.36 |
| 24-Hour Price Change | -1.66% |
| Fear & Greed Index Score | 24/100 (Extreme Fear) |
For institutions, sustained outflows pressure market makers and increase hedging costs. The SEC's approval of spot Ethereum ETFs in 2024 created structural liquidity that now shows fragility. For retail, this signals reduced institutional confidence and potential further downside. Market structure suggests outflows could trigger a Gamma Squeeze if options dealers adjust hedges aggressively. The broader impact relates to Ethereum's transition to proof-of-stake and upcoming EIP-4844 upgrades, which require stable capital flows for network development.
Market analysts on X highlight the outflow concentration in Grayscale's product. One quant noted, "ETHE's premium erosion suggests arbitrage desks are active." Bulls point to Ethereum's fundamental upgrades, while bears emphasize the technical breakdown below $3,000. Sentiment remains polarized with "Extreme Fear" prevailing.
Bullish case: If ETF flows reverse and Ethereum holds the $2,800 Fibonacci support, a rally to $3,500 is possible. This requires a break above the 50-day MA and filling the FVG at $3,200. On-chain data indicates whale accumulation could signal a bottom.
Bearish case: Continued outflows below $2,900 target the $2,750 invalidation level. Market structure suggests a liquidity grab could extend to $2,600. The Fear & Greed Index at 24 shows capitulation risk remains high.
What caused the Ethereum ETF outflows?Data indicates institutional rebalancing and profit-taking after brief inflows ended a seven-day outflow streak.
How does this affect Ethereum's price?ETF flows directly impact liquidity and sentiment, creating selling pressure that technical levels must absorb.
Is this similar to Bitcoin ETF outflows?Yes, both products show correlated outflow patterns, as analyzed in our report on Bitcoin ETF movements.
What is the Fear & Greed Index?A sentiment indicator combining volatility, momentum, and social media data. A score of 24 signals "Extreme Fear."
Where can I track ETF flow data?Sources like TraderT and Bloomberg provide daily updates. The SEC.gov website offers official filings for verification.
Source Note: Market data and factual reporting in this article are sourced from original reports. Commentary and analysis provided by CoinMarketBuzz.

Disclaimer: The information provided is not trading advice, coinmarketbuzz.com holds no liability for any investments made based on the information provided on this page. We strongly recommend independent research and/or consultation with a qualified professional before making any investment decisions.
coinmarketbuzz.com leverages advanced AI technology to analyze market data. All content is fact-checked and reviewed by our editorial team to ensure accuracy and neutrality.